Environmental data helped inside known environments but failed to transfer to a withheld environment
Filtered daily environmental covariates produced the highest macro Pearson predictive ability in CV1 and CV2. For CV0, where each environment was withheld in turn, genomic-only prediction was best and every environmental-covariate model reduced accuracy.
When does environmental information improve soybean genomic prediction?
Soybean grain yield depends on both genotype and environment. Environmental kernels can help models share information among trials with similar weather patterns, but the value of that information depends on whether the target environment is already represented in training.
Scientific question
Do daily, filtered, stage-summarized, or season-average environmental covariates improve soybean yield prediction beyond genomic-only and genotype-by-environment models—and do those gains persist when predicting a novel environment?
| Organism | Glycine max soybean |
|---|---|
| Public dataset | Dryad DOI 10.5061/dryad.2fqz6133v |
| Phenotype | Grain yield in kg/ha; 5,516 observations |
| Genotypes | 1,379 SoyNAM lines |
| Environments | IA, IL, IN, and NE in 2012 |
| Markers | 4,611 SNPs supplied; 4,420 retained after QC |
| Primary endpoint | Macro within-environment Pearson predictive ability |
Three breeding scenarios
| Scenario | Held out | Decision represented |
|---|---|---|
| CV1 | Genotypes | Untested genotypes in observed environments |
| CV2 | Observations within genotype | Tested genotypes with observations withheld |
| CV0 | Environment | Tested genotypes in a novel environment |
Environmental covariates are predictive inputs here, not causal effects. CV0 uses weather data for the withheld environment to project its environmental kernel; it tests whether an EC-to-phenotype relationship transfers, not whether weather data are available.
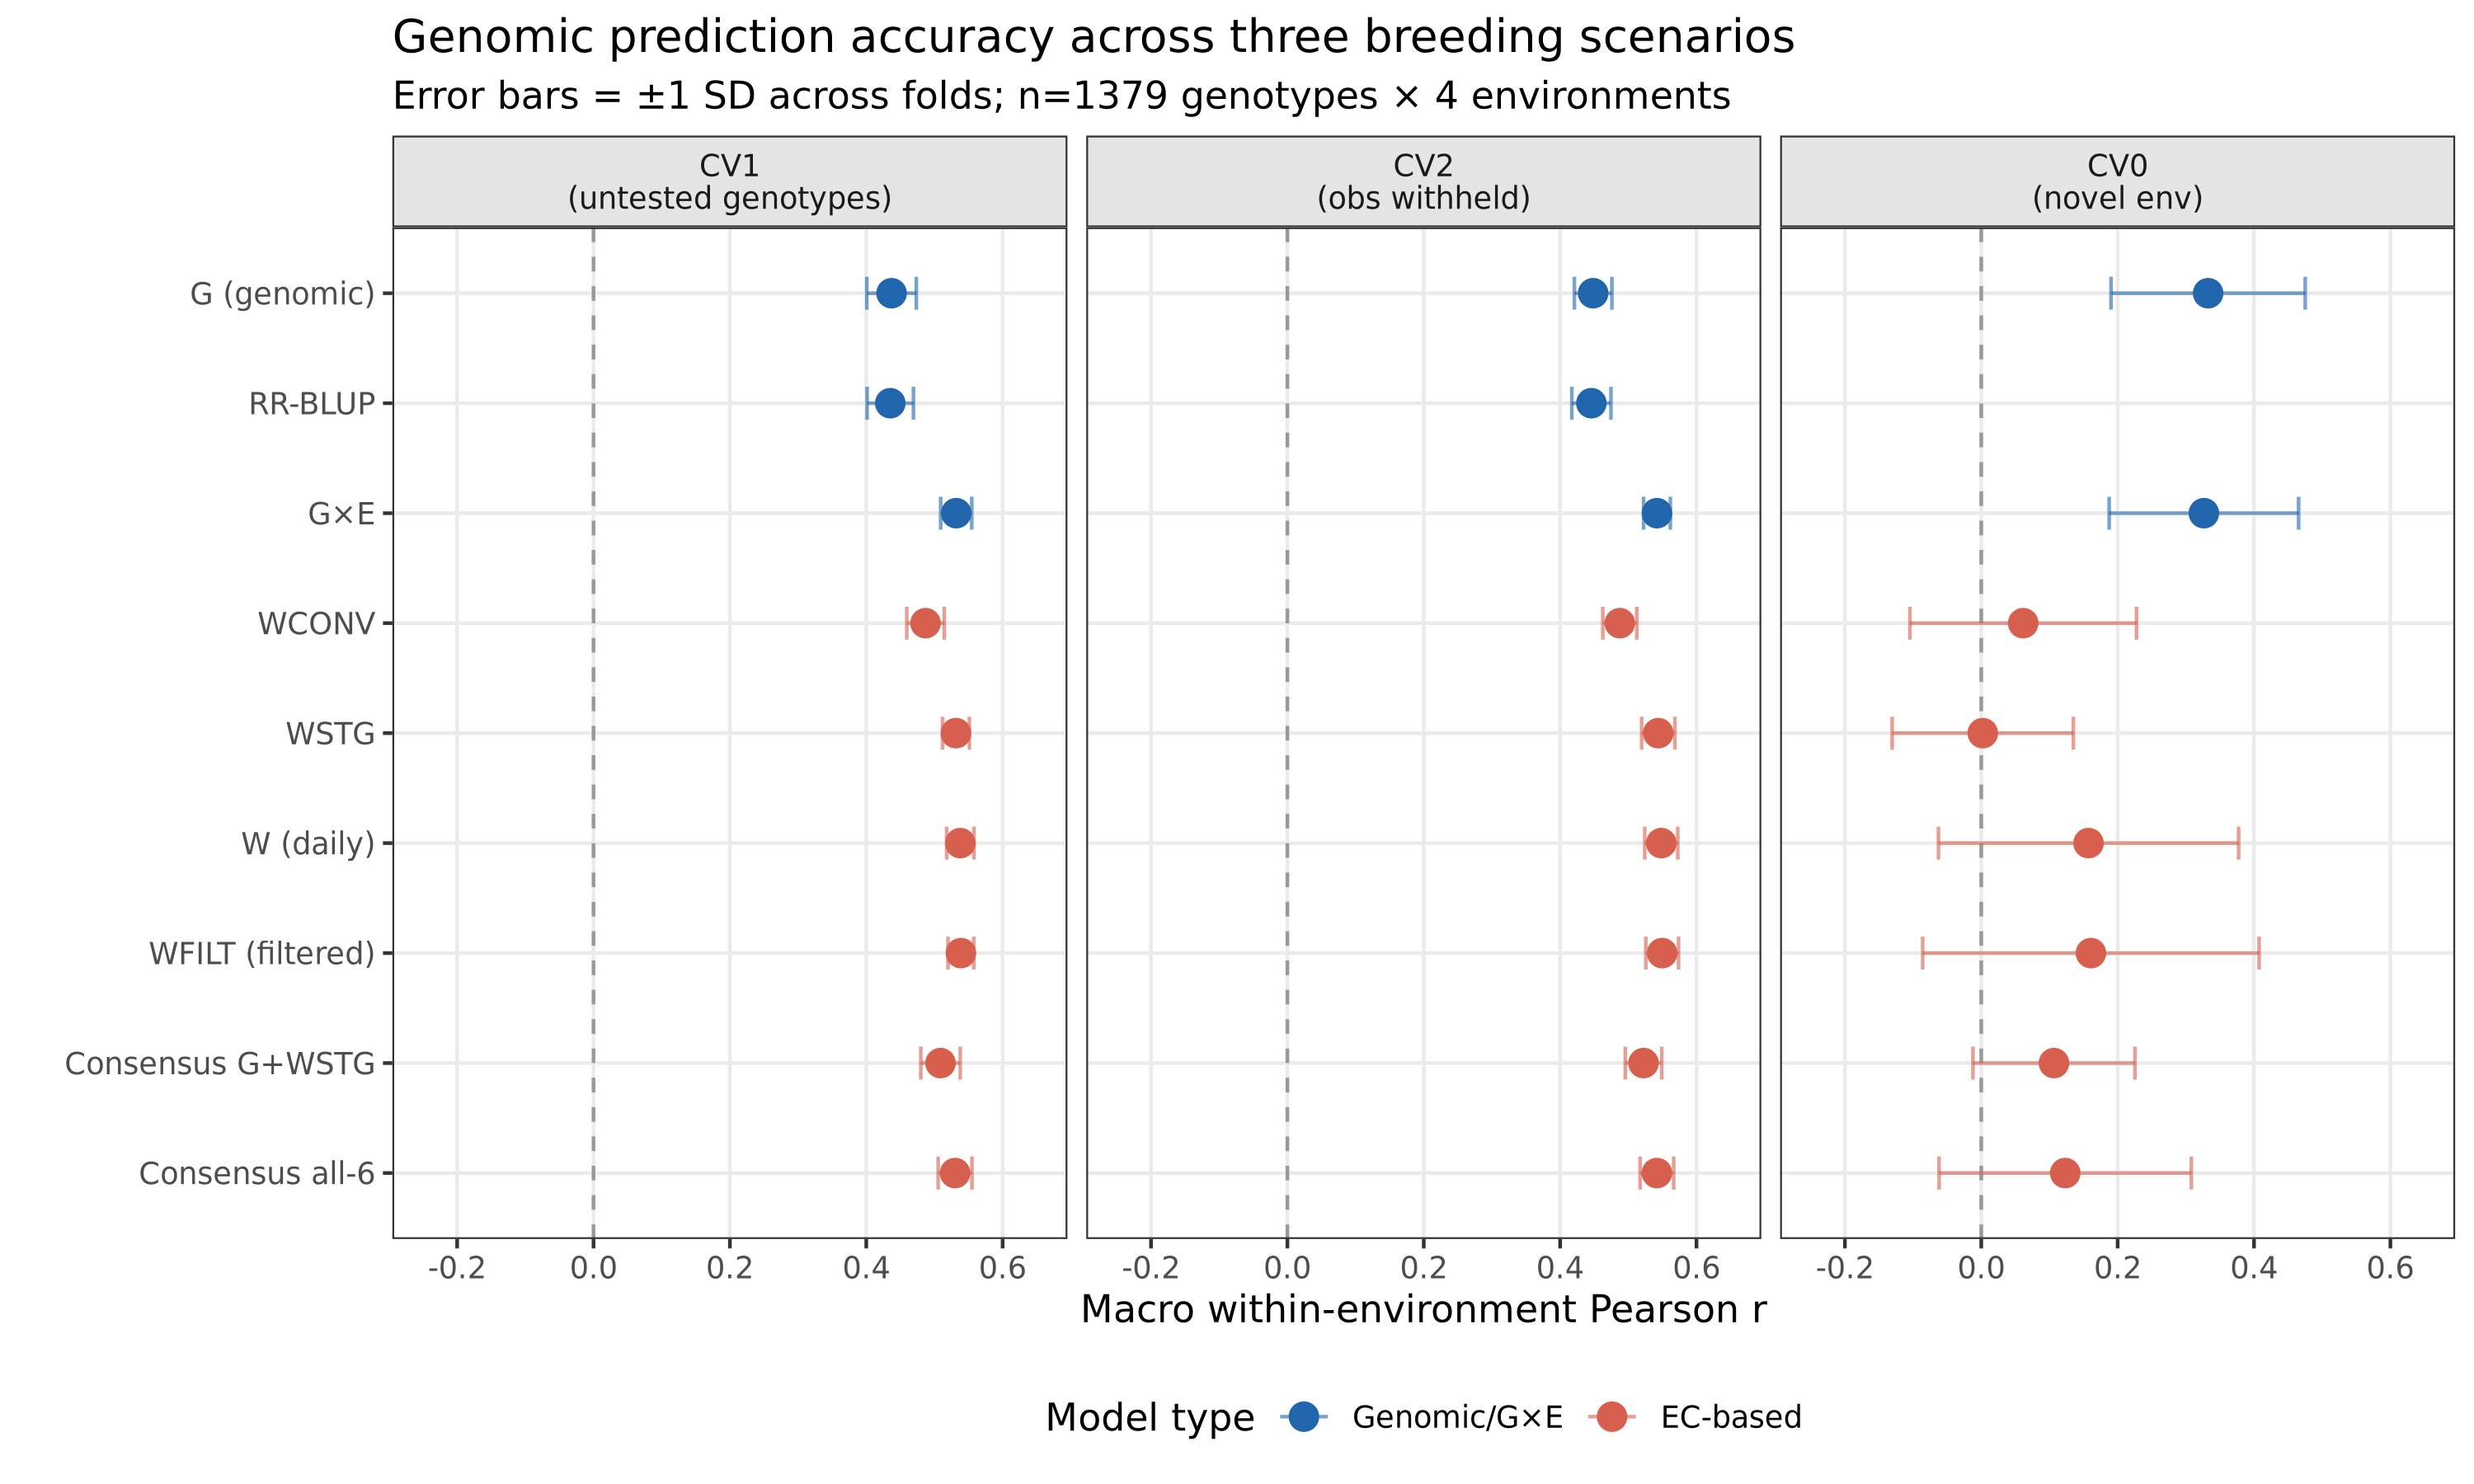
Matched validation splits for genomic, G×E, environmental-kernel, and consensus models
Filtered daily environmental covariates improved CV1 and CV2 by about 23%
WFILT improved macro Pearson by +0.102, or 23.3%, over the genomic-only baseline of 0.437.
WFILT improved macro Pearson by +0.101, or 22.6%, over the genomic-only baseline of 0.448.
WFILT exceeded marker-based G×E by only +0.007 in CV1 and +0.008 in CV2.
Season-average WCONV reached 0.487 in both scenarios, below daily, filtered, and stage-summarized representations.
Performance varied across the four observed environments
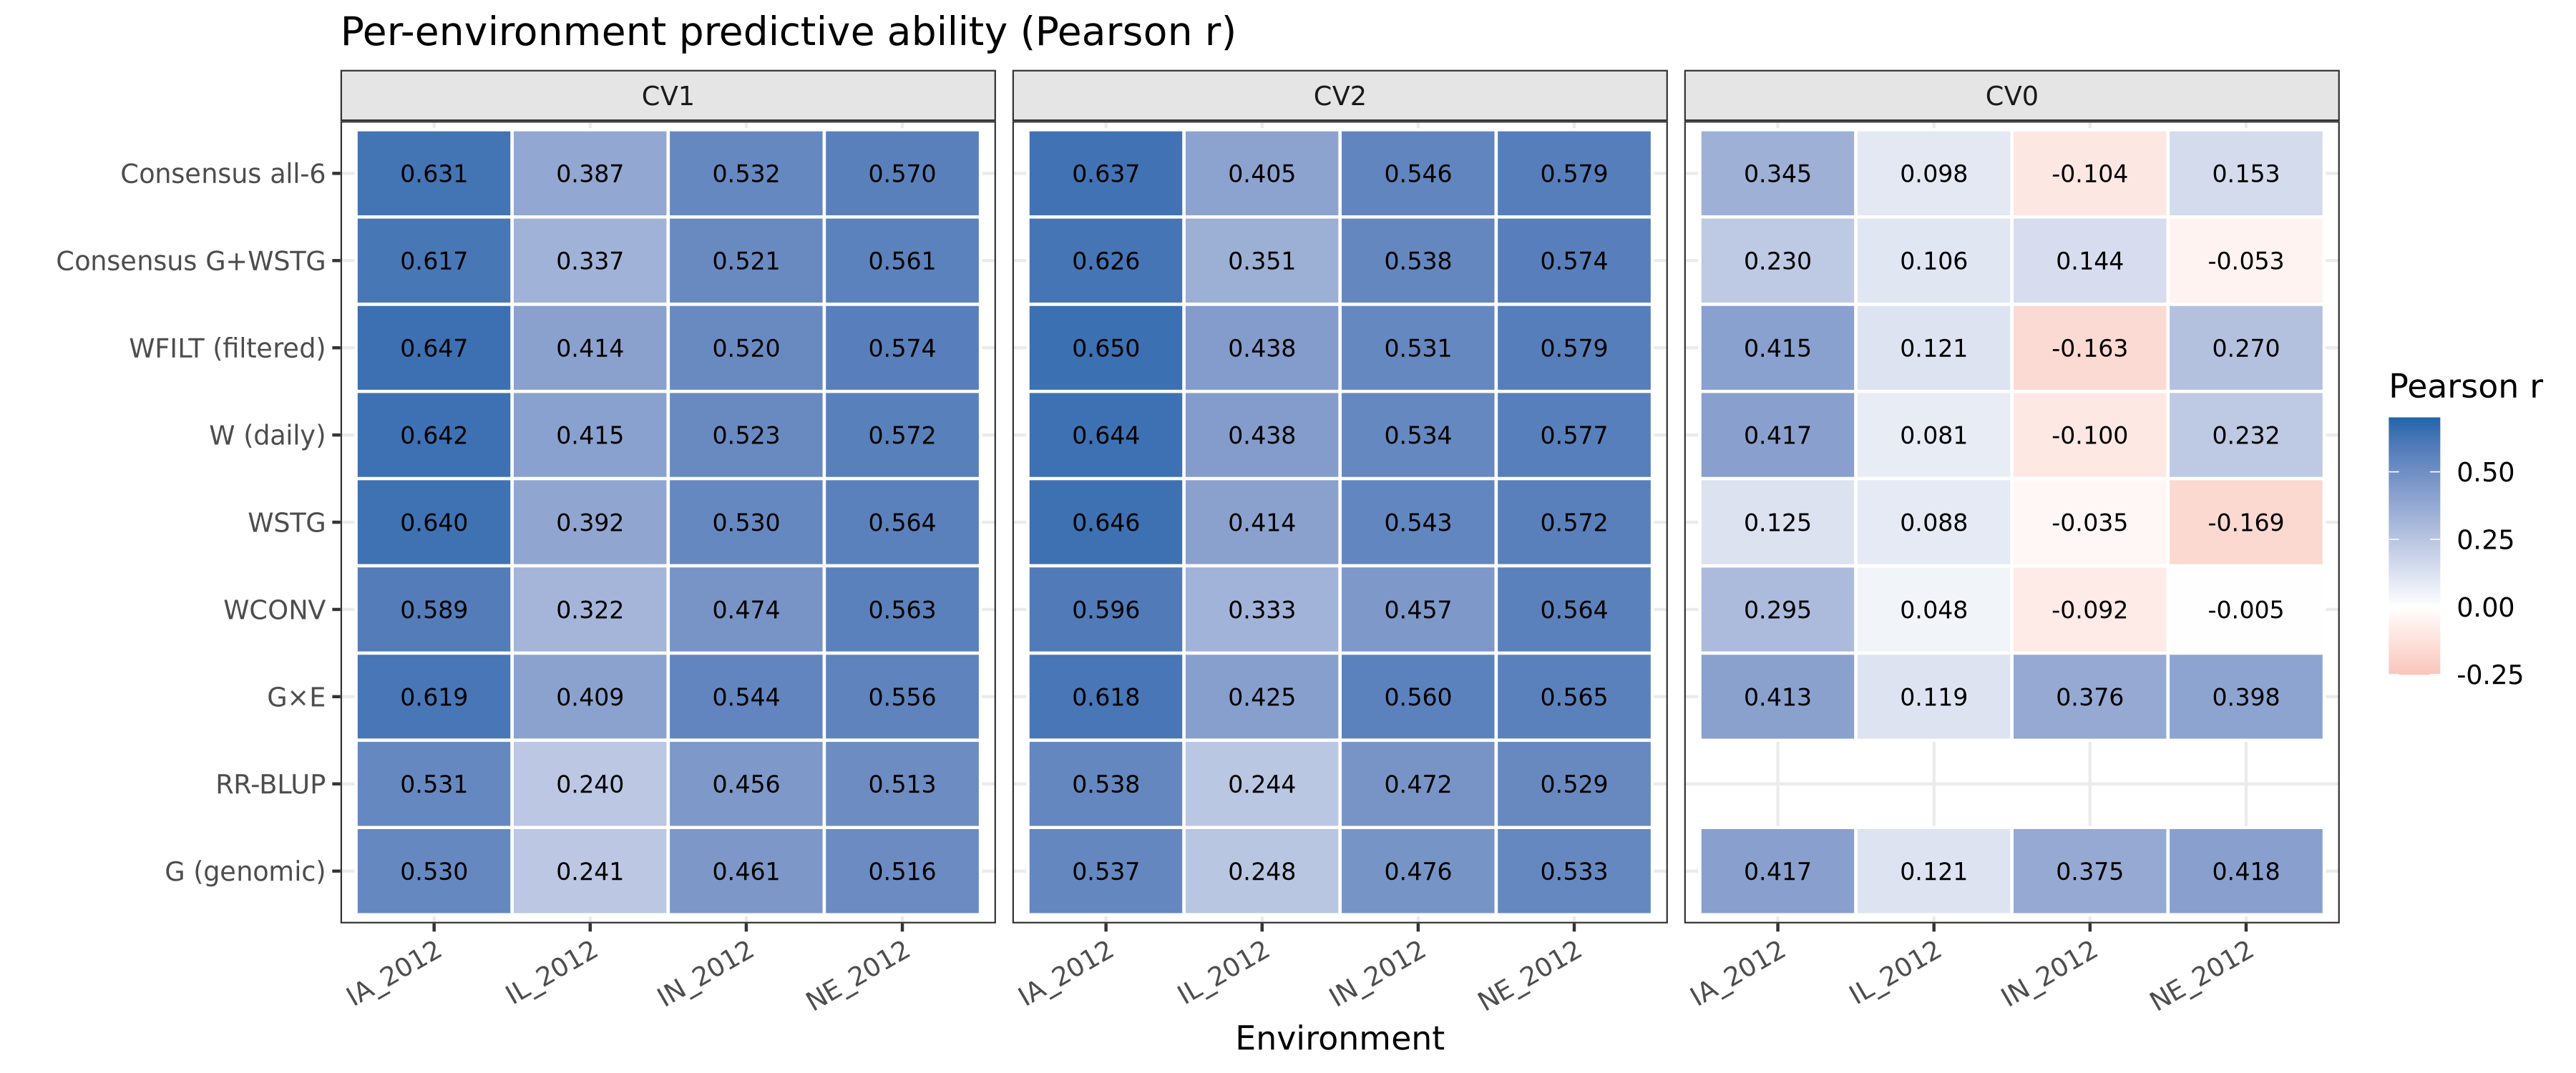
Because EC kernels contain only four unique environment patterns and have rank no greater than three, much of their CV1/CV2 gain may reflect improved environment-level similarity rather than a stable genotype-by-weather interaction. The narrow +0.007 to +0.008 margin over G×E supports that cautious reading.
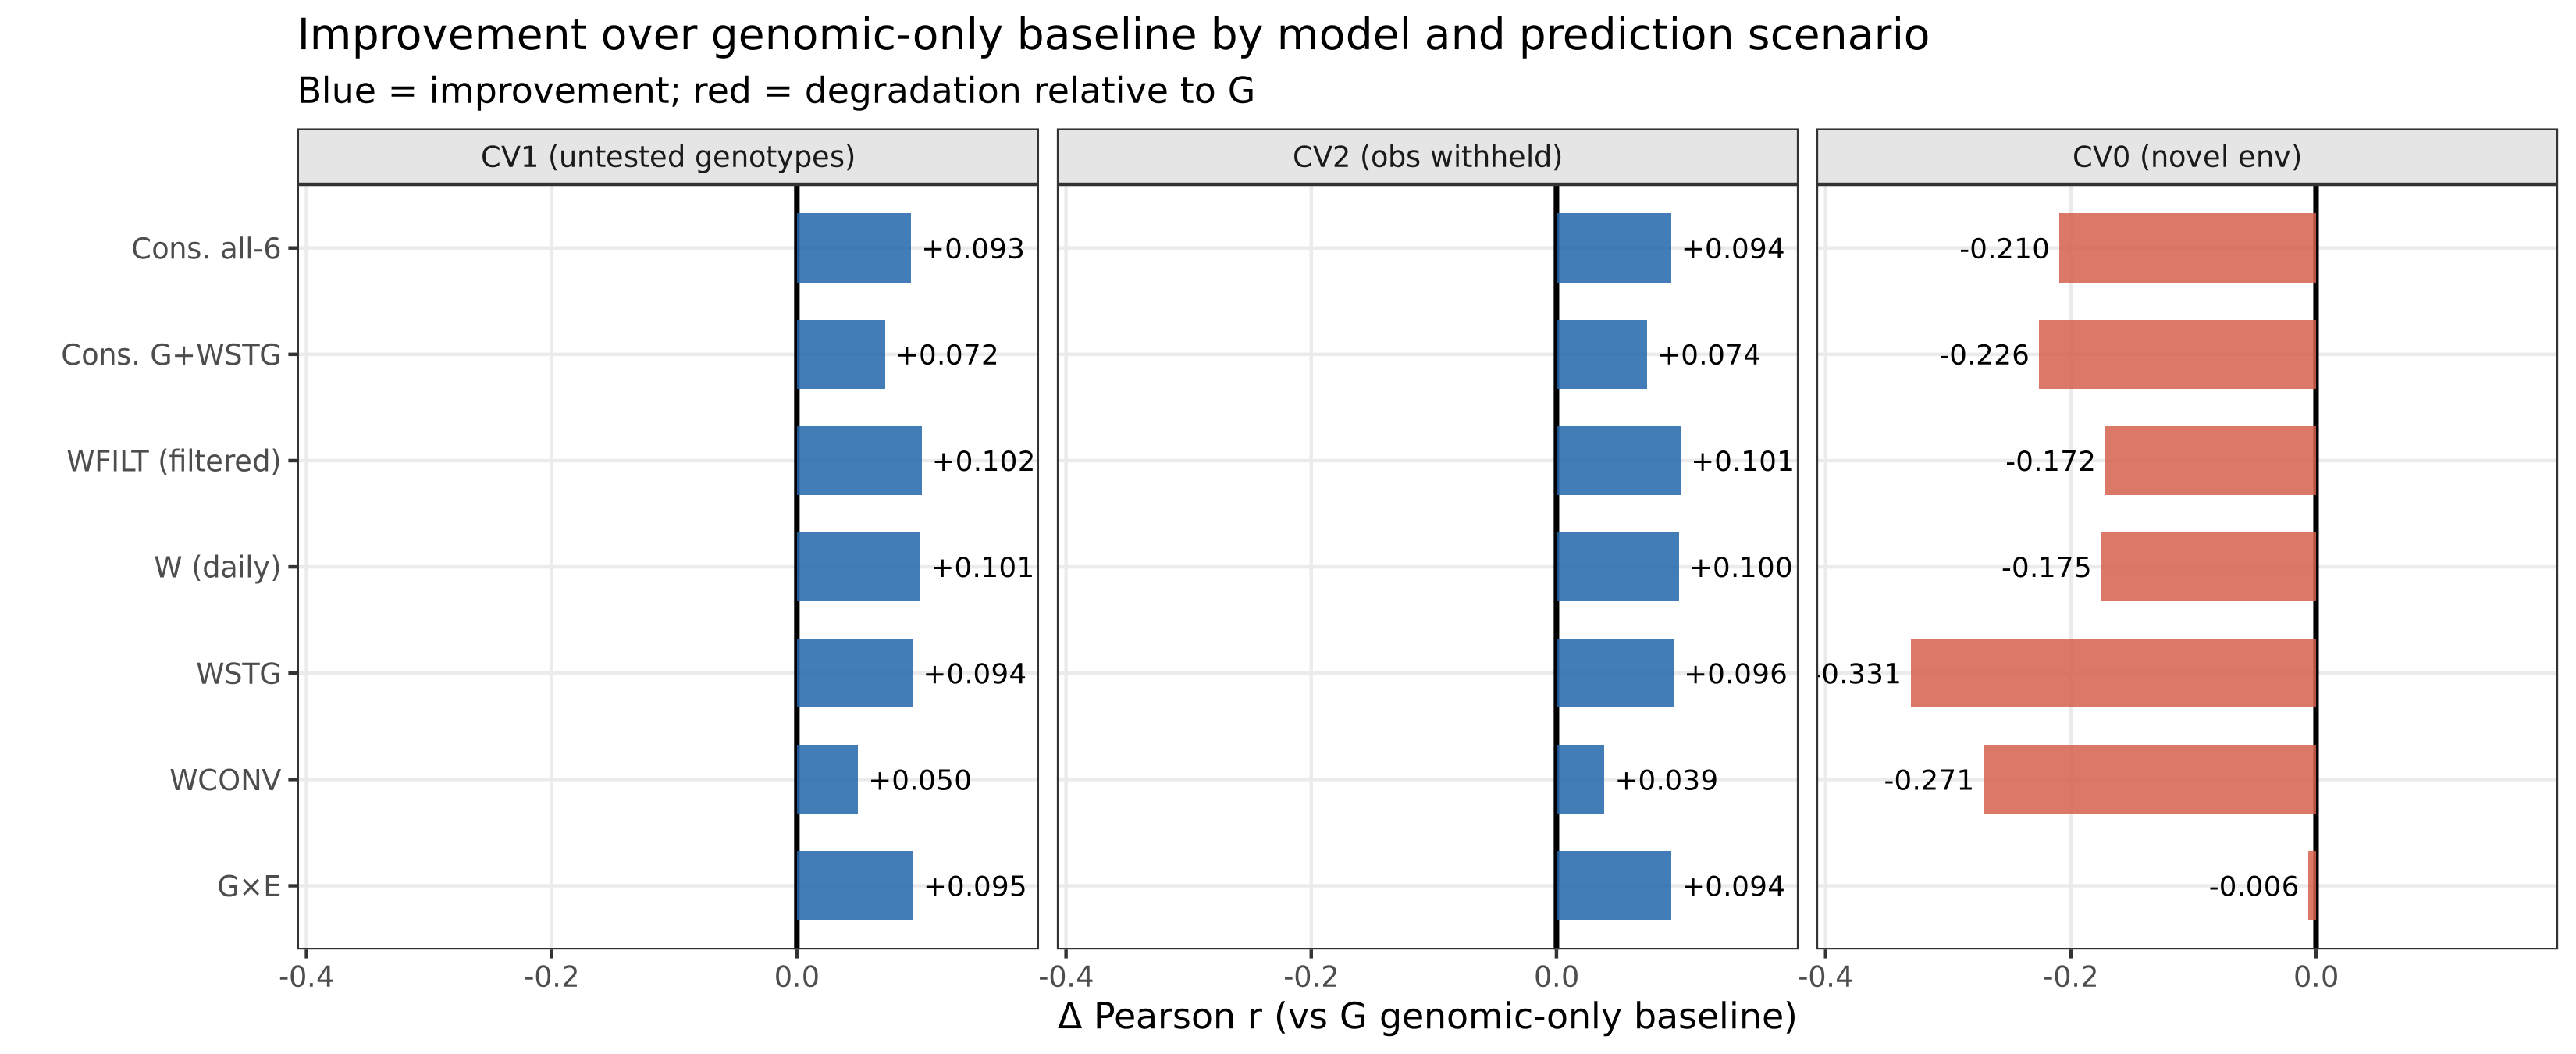
Environmental covariates harmed prediction when the environment was withheld
In CV0, genomic-only prediction reached macro Pearson 0.333 and marker-based G×E reached 0.327. WFILT fell to 0.161, daily W to 0.157, season-average WCONV to 0.061, and stage-summarized WSTG to 0.002.
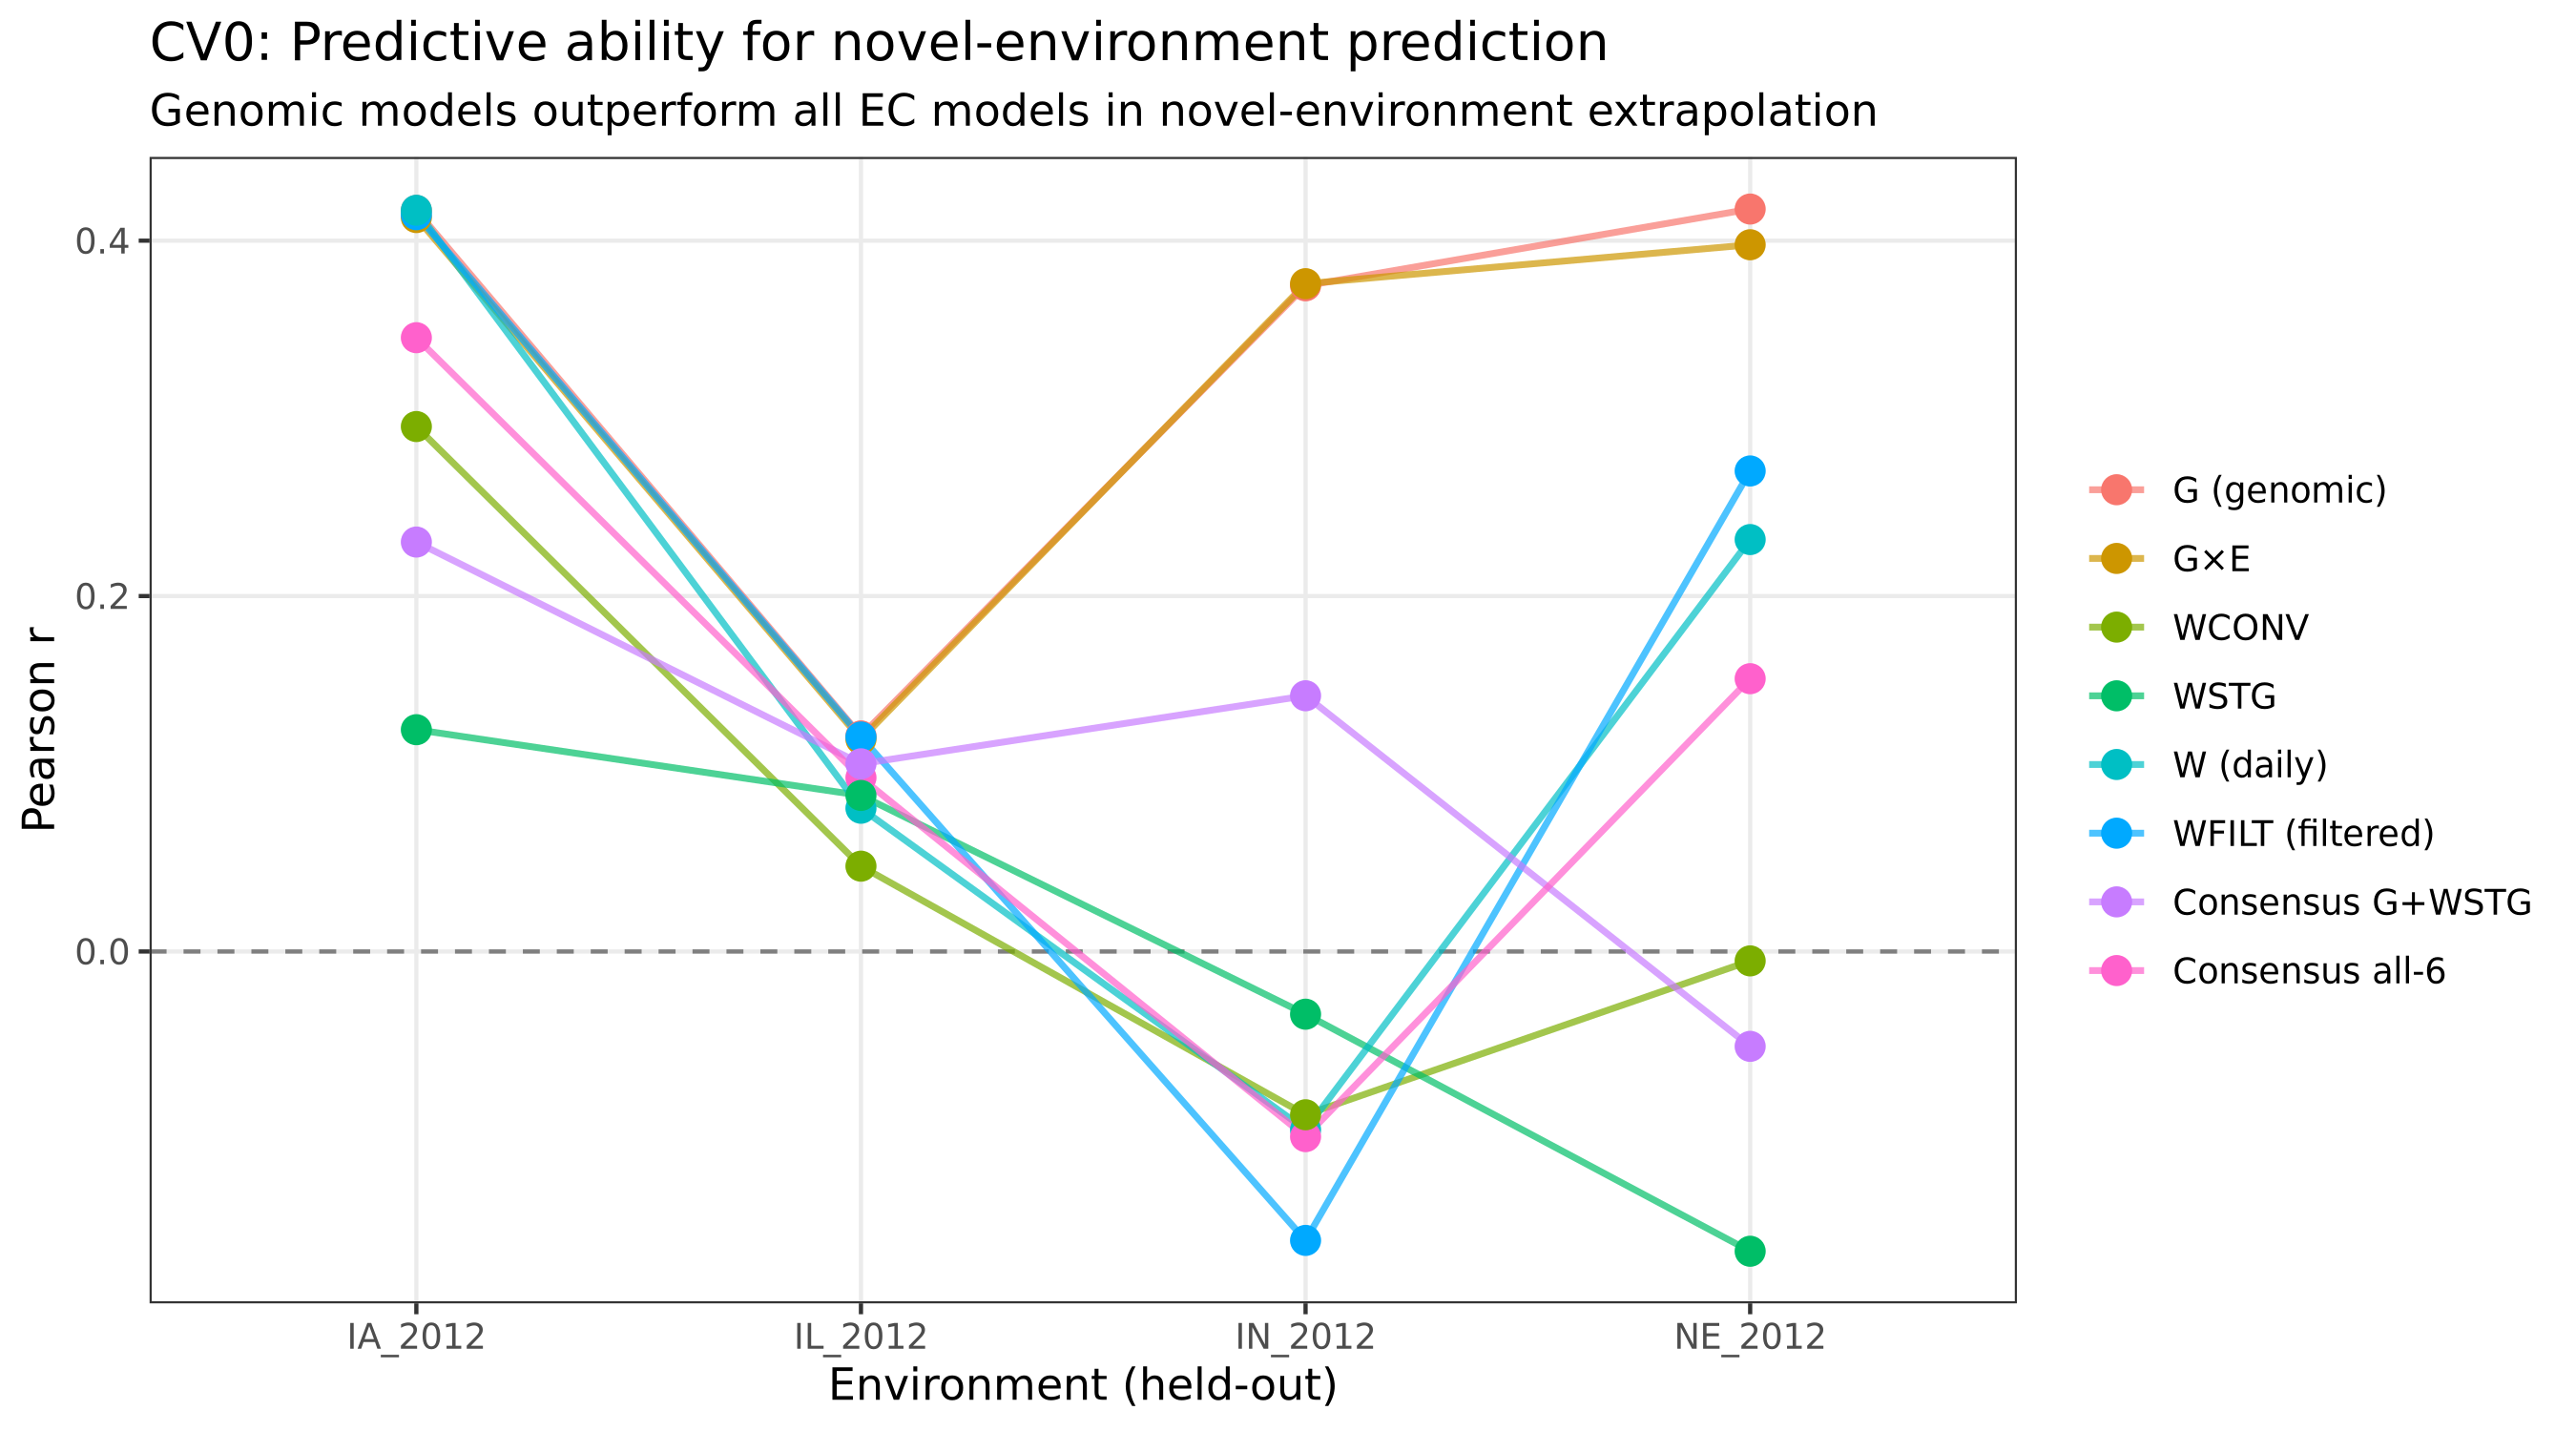
The genomic-only model was the best CV0 model.
Filtered daily EC accuracy was 0.172 Pearson lower than genomic-only prediction.
Stage-summarized environmental prediction was nearly uninformative on average.
Each environment contributes one CV0 fold; the reported SD of 0.142 for genomic-only prediction is not a confidence interval.
With one environment withheld, the EC kernel is calibrated on only three environments and has rank no greater than two. The observed failures show that the fitted environmental similarity did not transfer reliably; a larger multi-year environment panel is needed before inferring a general mechanism.
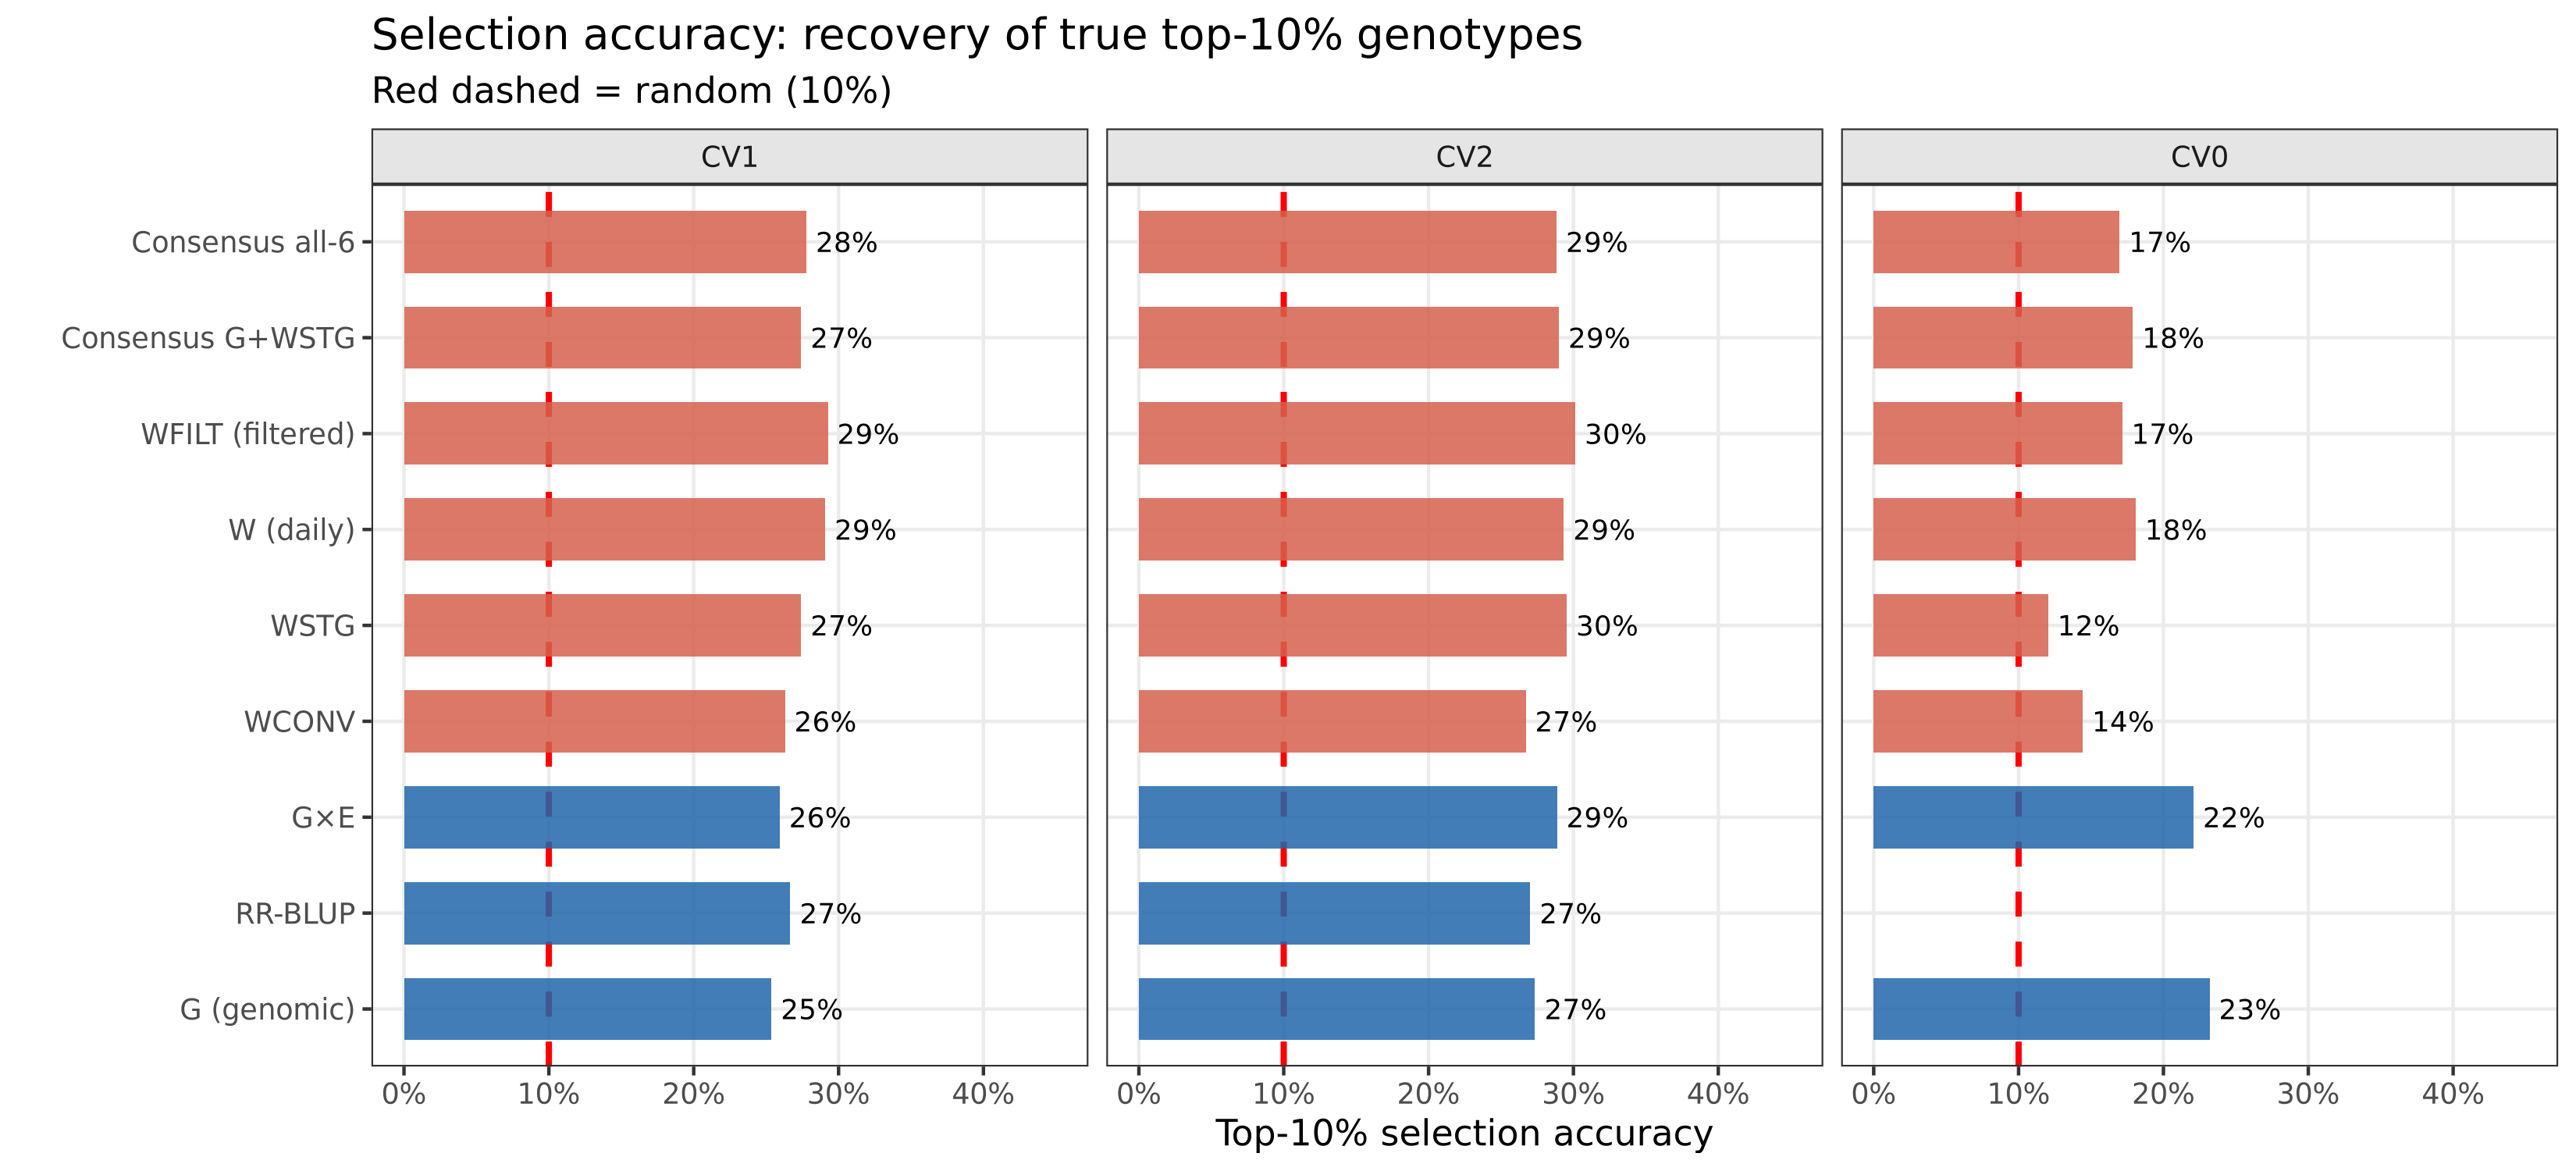
Environmental models recovered more top lines in known environments but fewer in CV0
| Model | CV1 top 10% | CV2 top 10% | CV0 top 10% |
|---|---|---|---|
| Random | 10.0% | 10.0% | 10.0% |
| Genomic only | 25.4% | 27.4% | 23.2% |
| G×E | 25.9% | 28.9% | 22.1% |
| WFILT | 29.3% | 30.1% | 17.2% |
| WSTG | 27.4% | 29.5% | 12.0% |
The direction and model ranking agree with Sagae et al. (2026)
The source study used the same 1,379 genotypes, four environments, and 4,611 supplied SNPs. It reported that environmental covariates improved CV1/CV2, season-average summarization performed worst among EC representations, and genomic or G×E models were strongest in CV0.
| Comparison | Sagae et al. (2026) | This analysis |
|---|---|---|
| Genomic baseline, CV1/CV2 | Approximately 0.42 | 0.437 / 0.448 |
| Best EC, CV1/CV2 | Approximately 0.56 | 0.539 / 0.550 |
| Best CV0 model | G×E or genomic, approximately 0.33 | Genomic only, 0.333 |
| EC ranking | AVG < STG < FILT ≈ ALL | WCONV < WSTG < W ≈ WFILT |
| ECs hurt CV0 | Yes | Yes |
The agreement is directional rather than an exact reproduction. This run used one CV repetition, shorter MCMC chains, truncated eigendecomposition, and raw phenotypes; the source study used ten repetitions, longer chains, and its published phenotype-processing pipeline.
Four environments cannot establish a transferable weather-response model
- The analysis contains only four environments from one year. Environmental kernels have rank no greater than three and behave more like contrasts among known trials than continuous weather-response representations.
- CV0 has four folds—one per environment. Fold-level SD is unstable and must not be interpreted as a confidence interval.
- CV1 and CV2 used one cross-validation repetition rather than the source study’s ten, limiting precision of absolute performance estimates.
- BGLR used 4,000 iterations with 1,000 burn-in iterations rather than the published 12,000 and 2,000 settings.
- Raw yield observations were modeled; the source pipeline may have used environment-adjusted BLUEs.
- Stage-summarized ECs had 5% missingness and were mean-imputed, potentially contributing to WSTG’s weak CV0 performance.
- Marker missingness was 4.87% and was mean-imputed before kernel construction.
- The equal-weight consensus was assembled post hoc without nested training-fold weight selection and did not beat the best individual model in any scenario.
- CV0 used weather data from the withheld environment. The failure concerns model transfer across environments rather than predictor availability.
- Between-environment yield correlations ranged from 0.09 to 0.36, indicating substantial environment specificity and a strong need for broader multi-year validation.
The evidence strongly supports the scenario-dependent direction within this four-environment SoyNAM subset: ECs help when target environments are represented and hurt when extrapolating to the fourth environment. It does not establish that the same EC representation will generalize across years, regions, or larger trial networks.
Predictions, split registry, model registry, metrics, and literature comparison
The files below are recorded in the session inventory. This website publishes the complete session PDF and all five report-derived figures; the row-level artifacts remain documented for provenance.
metrics_summary.csvMacro and per-environment Pearson metrics for nine model variants across three scenariosselection_accuracy.csvTop-10% genotype-recovery accuracy by model and scenariocomparison_table.csvCombined baseline, EC, G×E, and consensus metricsevidence/predictions.csv143,416 row-level prediction recordsevidence/registry.jsonComplete 26-entry model registrysplits/split_registry.jsonFrozen fold assignments and split hashevidence/contract.jsonFrozen prediction and leakage-control contractliterature_comparison.jsonStructured comparison with Sagae et al. (2026)synthesis.jsonScenario-specific breeding-utility synthesis