A treatment contrast that accounts for baseline cell-line differences
Four dexamethasone-treated and four control samples span four cell lines. Including cell line in the model avoids treating all eight samples as exchangeable biological replicates.
Which genes change after dexamethasone treatment while controlling for cell line?
The input contained 63,677 gene-level count rows. Genes with fewer than 10 total counts were removed before modeling; 22,369 genes remained.
What treatment-associated gene-expression changes are detectable across four human airway smooth-muscle cell lines after accounting for line-specific baselines?
| Samples | 4 treated and 4 control |
|---|---|
| Cell lines | 4 |
| Model | DESeq2 design ~ cell + dex |
| Software | DESeq2 1.40.2 in R 4.3.0 |
| Filter | At least 10 total counts across samples |
Count filtering, normalization, modeling, and diagnostics
The treatment contrast produced broad expression changes
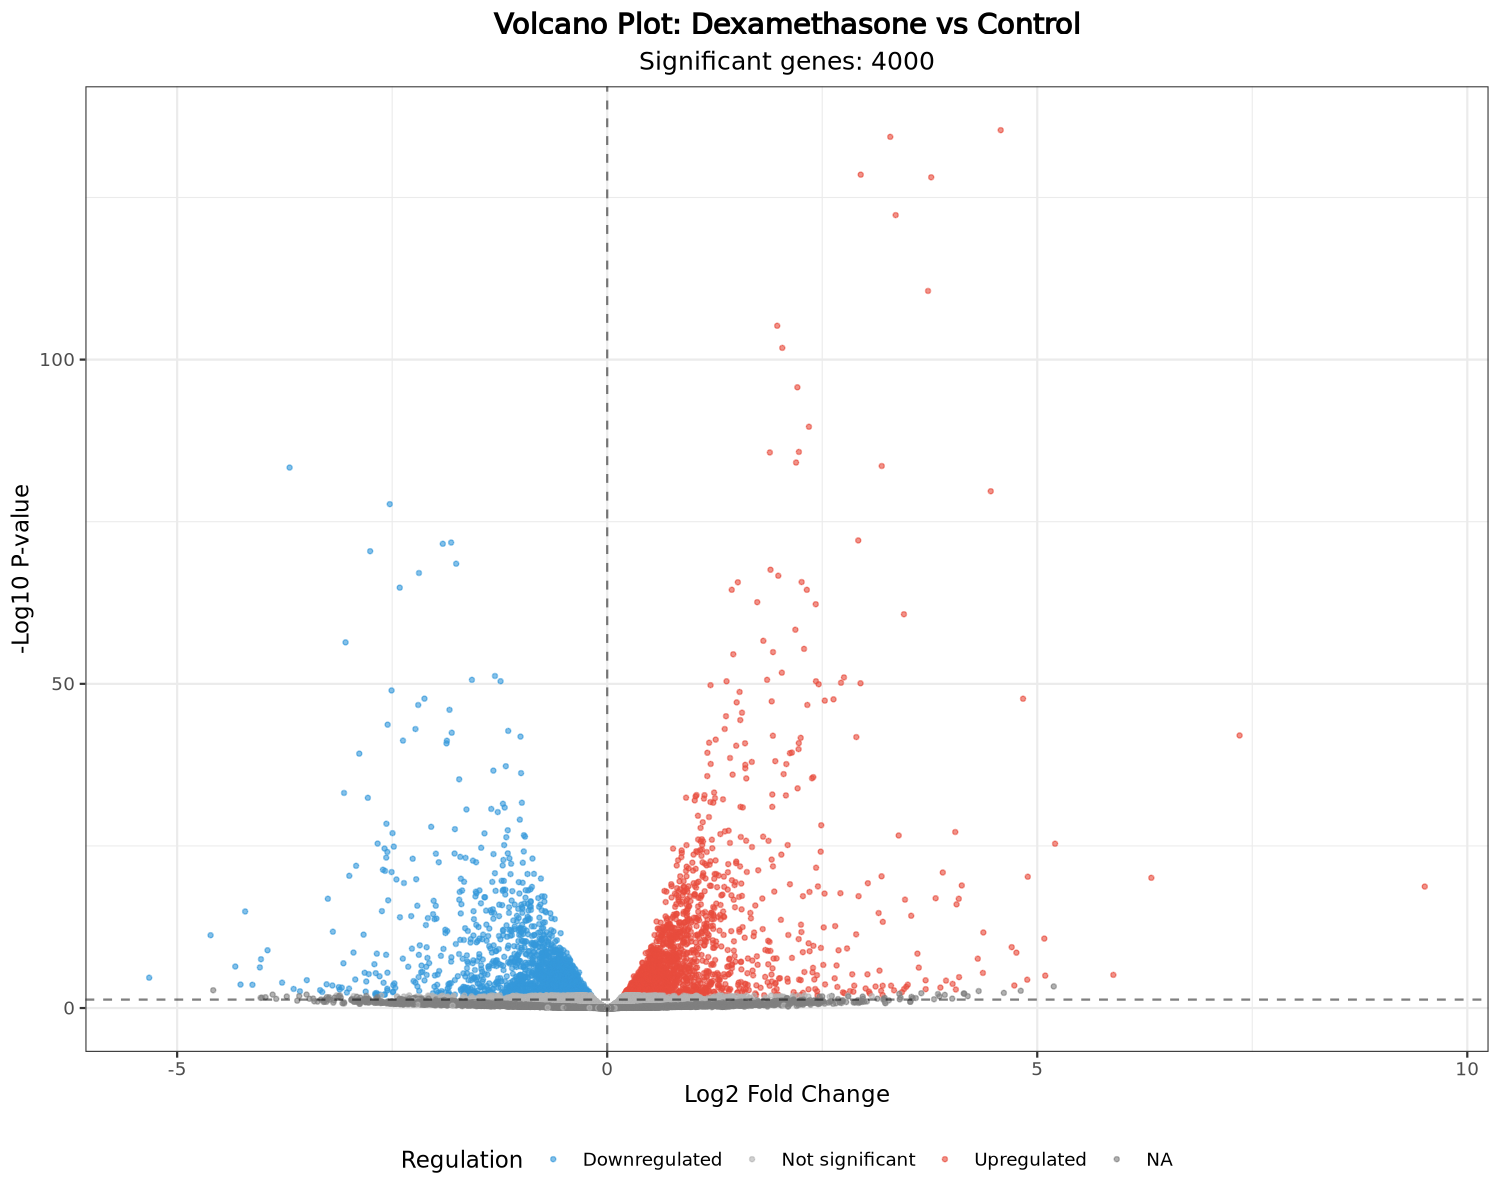
At adjusted p < 0.05, 2,193 increased and 1,807 decreased.
2,901 passed adjusted p < 0.01 and 2,073 passed adjusted p < 0.001.
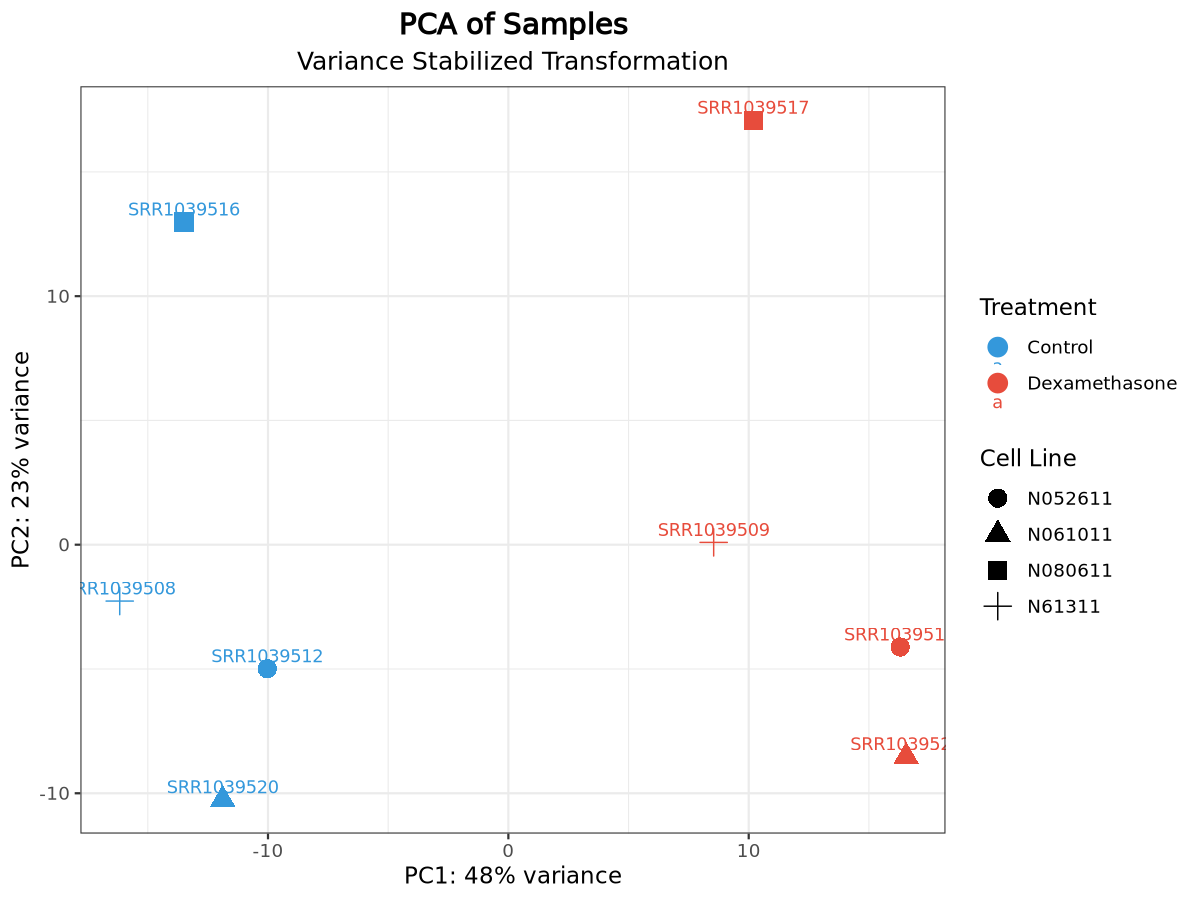
PC1 explained 48% and PC2 explained 23% of the displayed variance.
The design included cell line directly instead of pooling unmatched replicates.
The significant set contains both increases and decreases
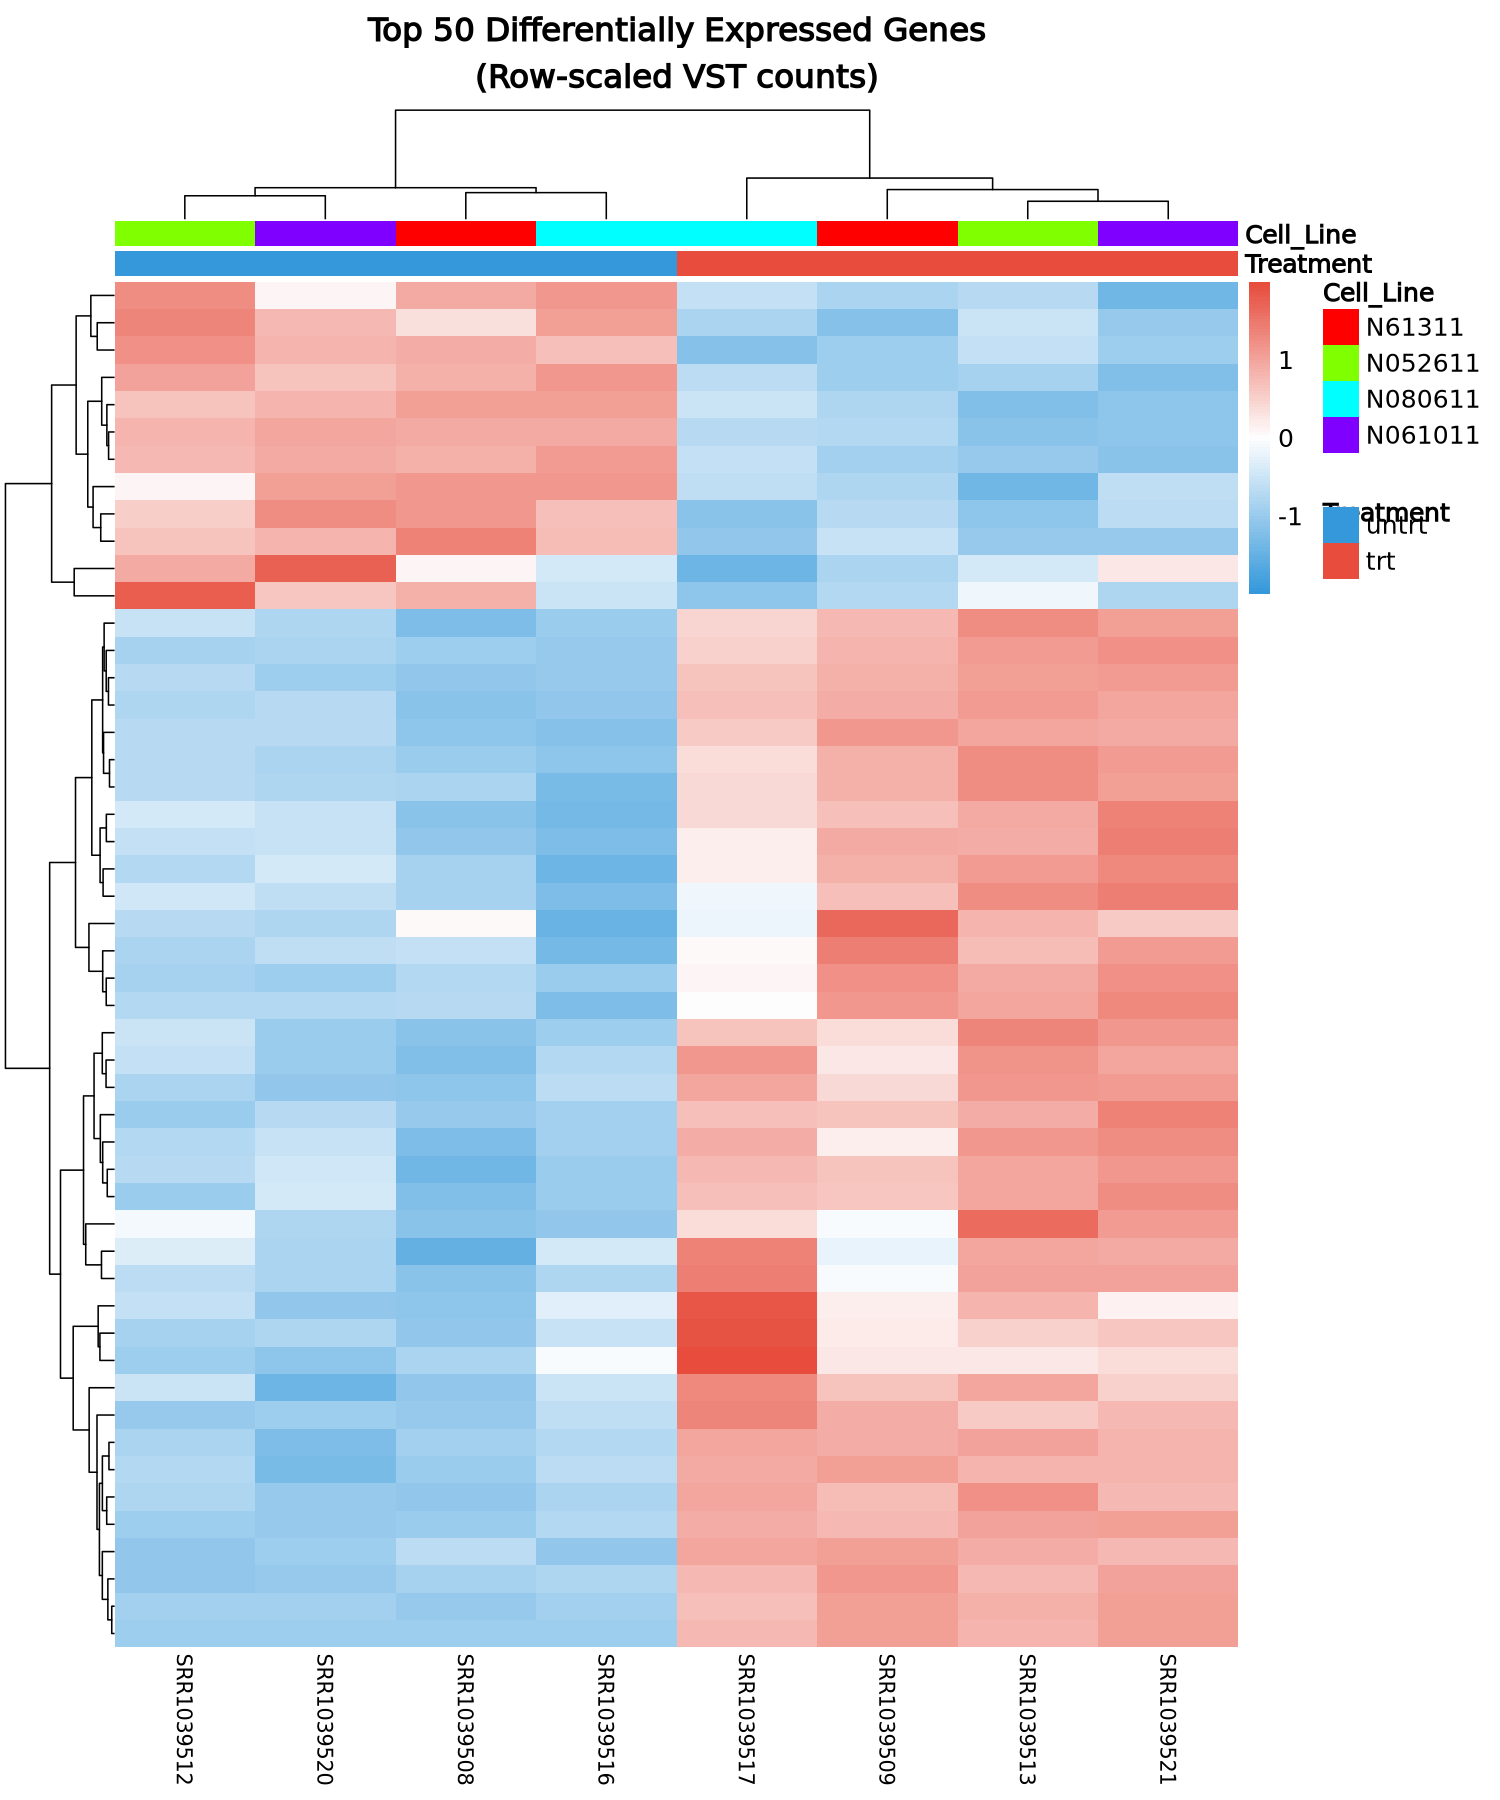
Top genes cluster samples by treatment in the report
What the eight-sample analysis cannot establish
- The dataset contains only eight samples across four cell lines.
- No additional covariates or cell-line-by-treatment interaction were modeled.
- The report does not provide a public accession or independent experimental validation.
- Pathway enrichment is not documented, so gene-level results should not be presented as a reproduced mechanism.
- Differential expression is an association with treatment and does not establish causality.
The strongest supported conclusion is a broad dexamethasone-associated expression shift after controlling for cell line. Mechanistic and clinical claims require separate evidence.
Artifacts recorded in the Pipette session
de_results.csvComplete DESeq2 resultsde_significant.csvFDR-significant genesnormalized_counts.csvNormalized values for 22,369 genesdeseq2_object.rdsFitted analysis objectde_config.jsonConfiguration and thresholdsprovenance.jsonExecution provenance