Public rice RNA-seq data, reanalyzed from raw reads
The analysis starts from public sequencing reads rather than a processed expression matrix. Alignment, gene quantification, filtering, and statistical thresholds are therefore part of the visible provenance rather than hidden assumptions.
Salt-alkali stress can reshape the rice transcriptome over time
Salt-alkali stress limits rice growth through ionic, osmotic, and high-pH stress. The experiment examined an early response and a response after longer Na₂CO₃ exposure; the two timepoints were therefore modeled separately.
Scientific question
Which genes change in rice seedlings after one and five days of Na₂CO₃ stress, and how much of the strict differential-expression response is shared between the two timepoints?
| Organism | Oryza sativa japonica rice seedlings |
|---|---|
| Public dataset | NCBI BioProject PRJNA895747 |
| Samples | 12 paired-end RNA-seq libraries |
| Design | Control and Na₂CO₃ treatment at Day 1 and Day 5; three biological replicates per group |
| Reference | IRGSP-1.0 |
| Contrasts | Day 1 treated vs control; Day 5 treated vs control |
The session prompt labels the cultivar Nipponbare, whereas the linked publication identifies Liaoxing No.1. The publication and BioProject are treated as authoritative here, but the source metadata mismatch should be resolved before a formal reproduction claim.
FASTQ → fastp → HISAT2 → featureCounts → DESeq2
Both timepoints followed the same count-based workflow and were tested as separate treatment-versus-control contrasts.
Day 5 produced the larger strict differential-expression response
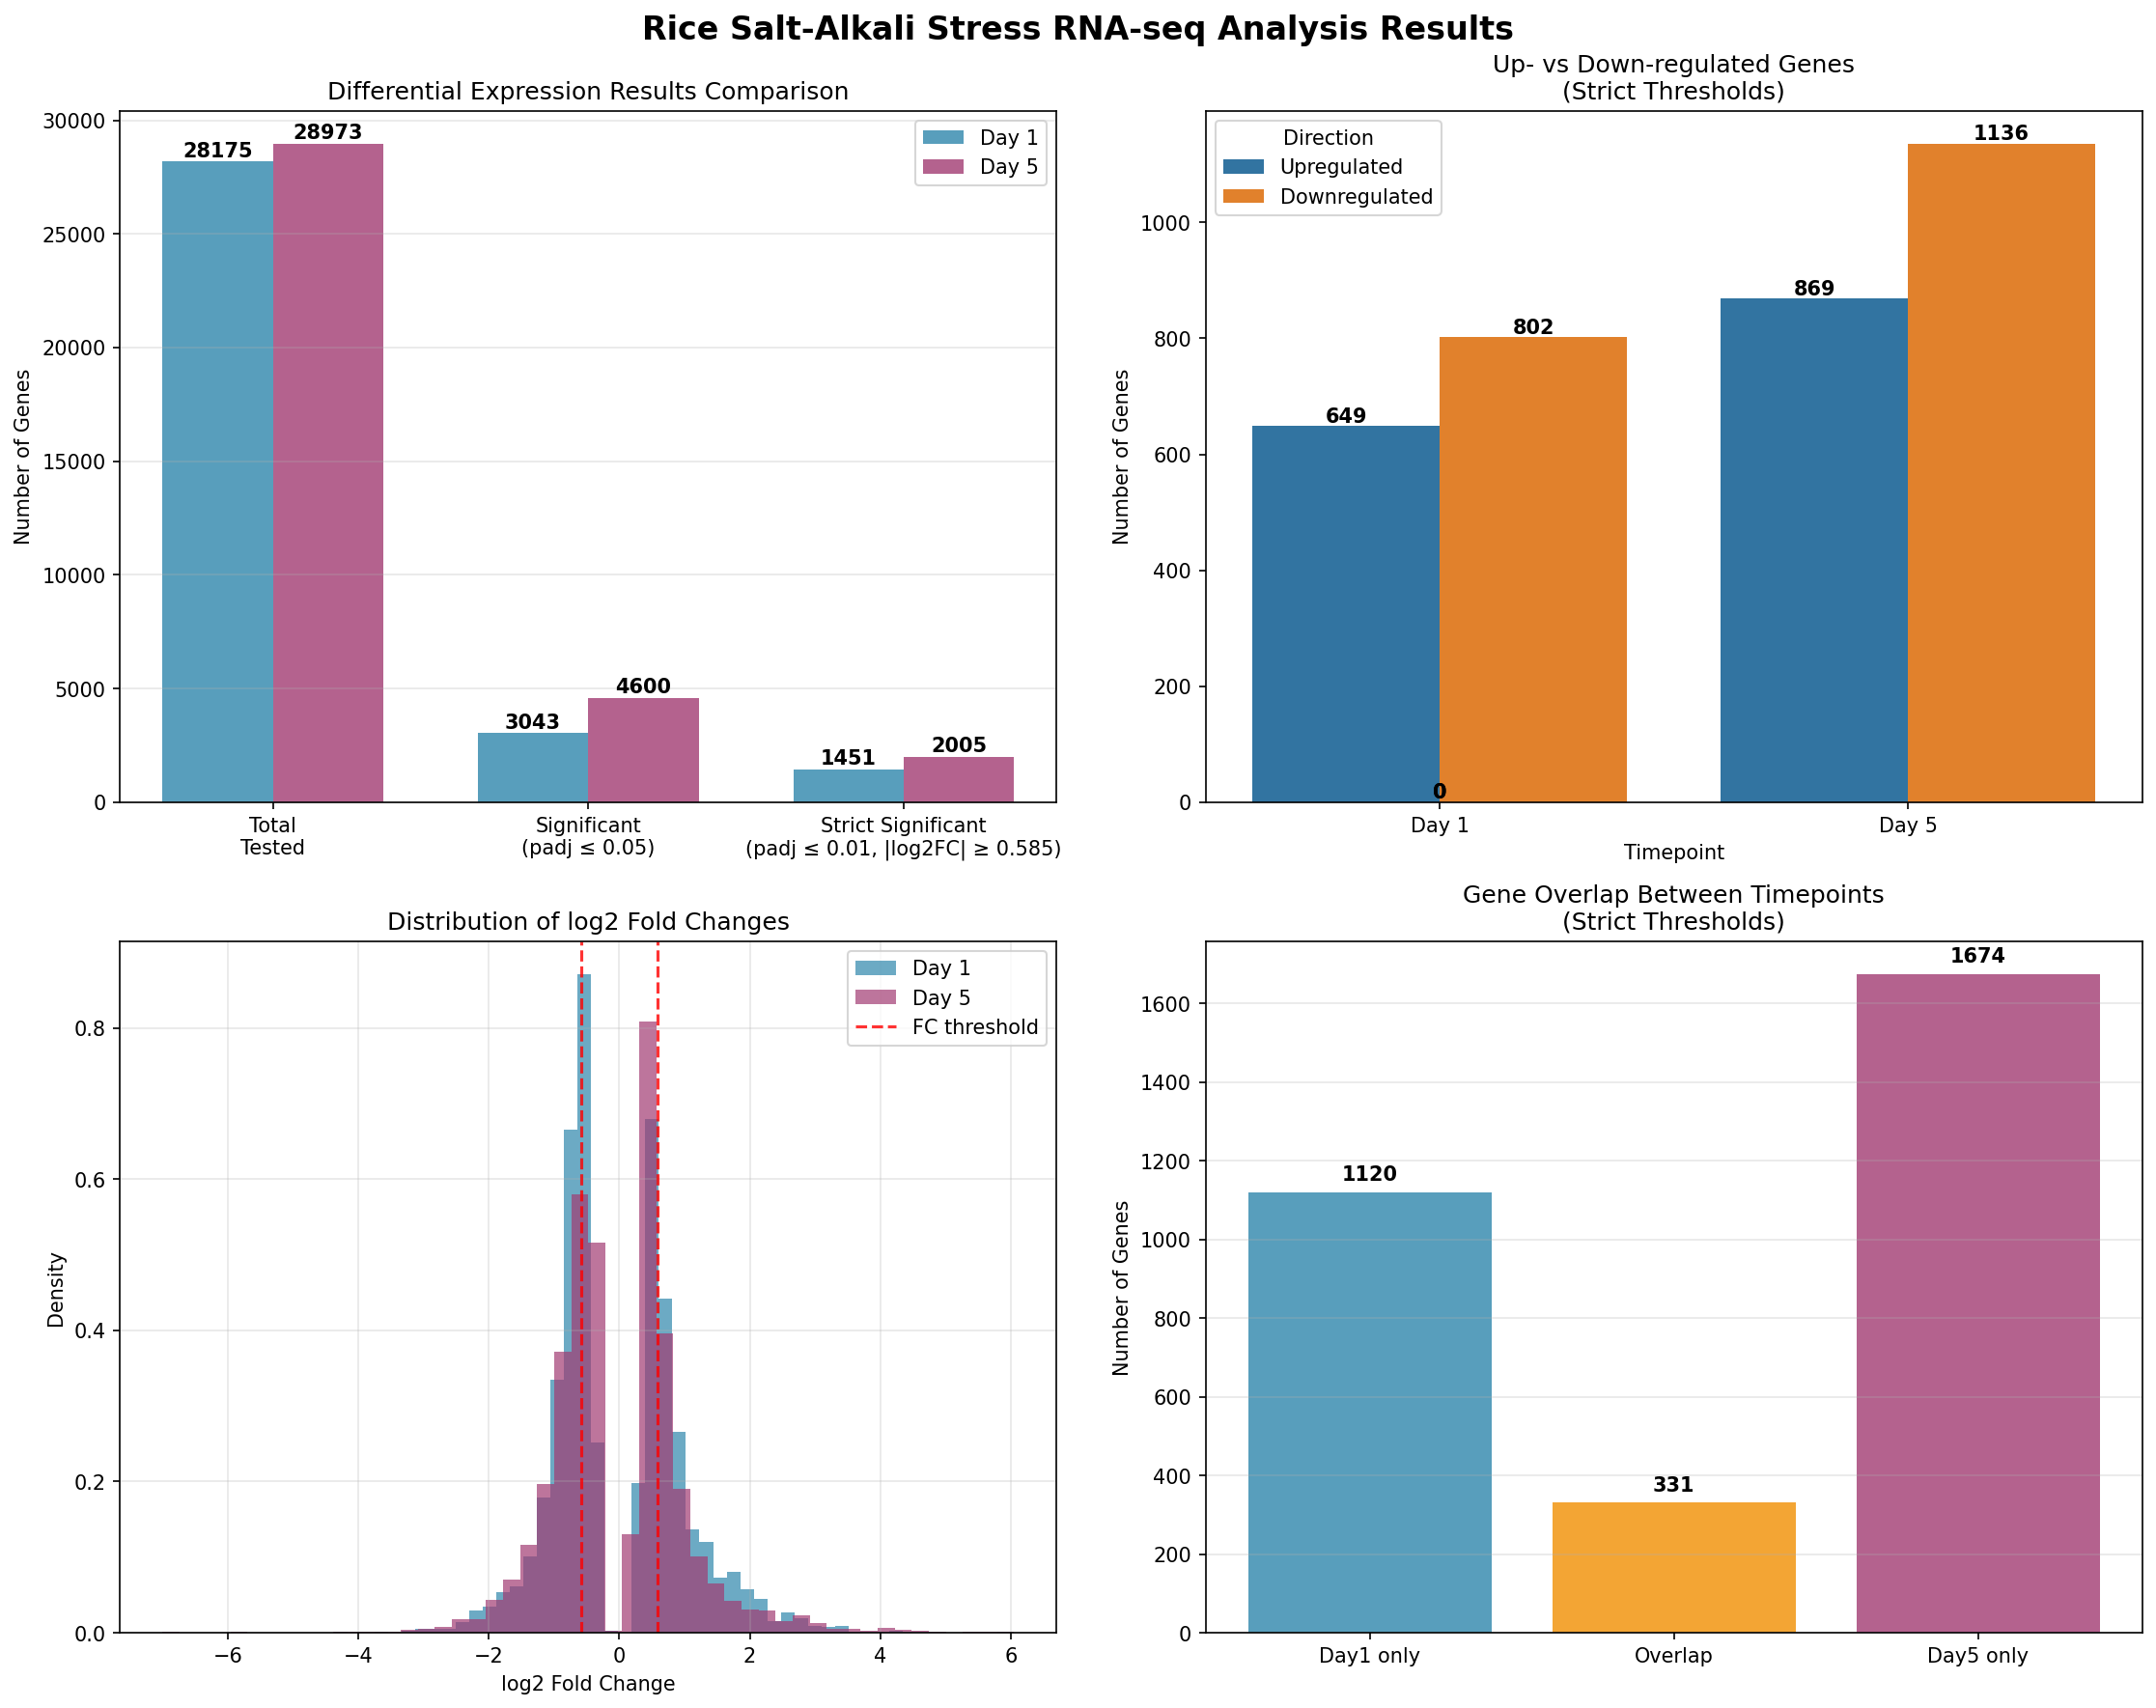
DESeq2 tested 28,175 genes at Day 1 and 28,973 at Day 5. Under the strict threshold, 1,451 genes were differentially expressed at Day 1 and 2,005 at Day 5—a 38% increase in the later response.
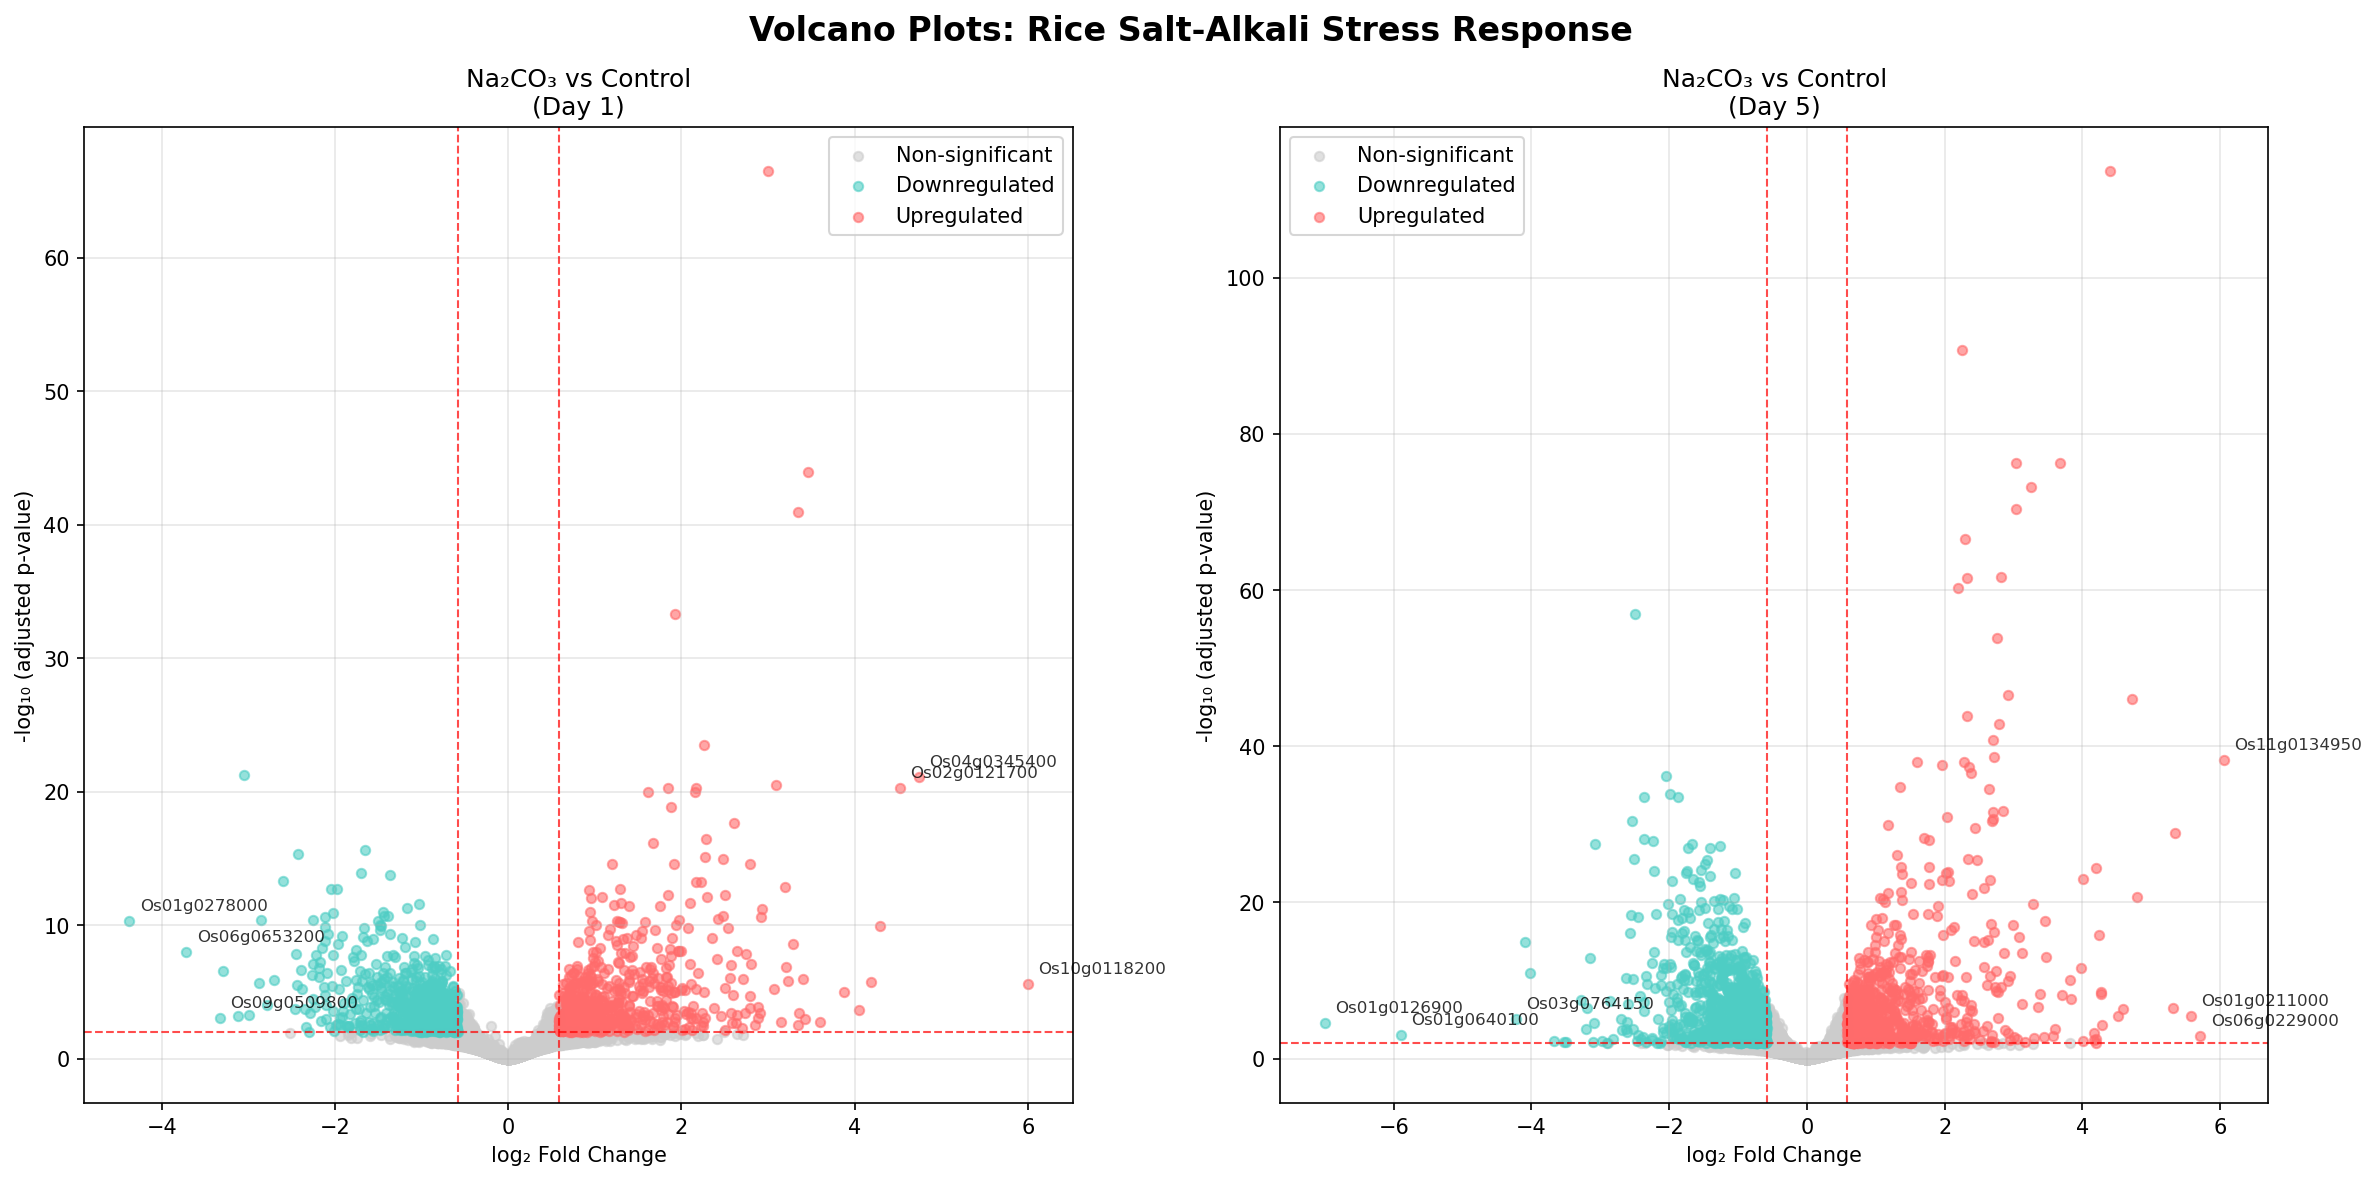
649 upregulated and 802 downregulated genes.
869 upregulated and 1,136 downregulated genes.
331 strict DEGs overlapped between timepoints.
1,120 genes were Day-1-specific and 1,674 were Day-5-specific.
Sequencing depth and gene detection were consistent across libraries
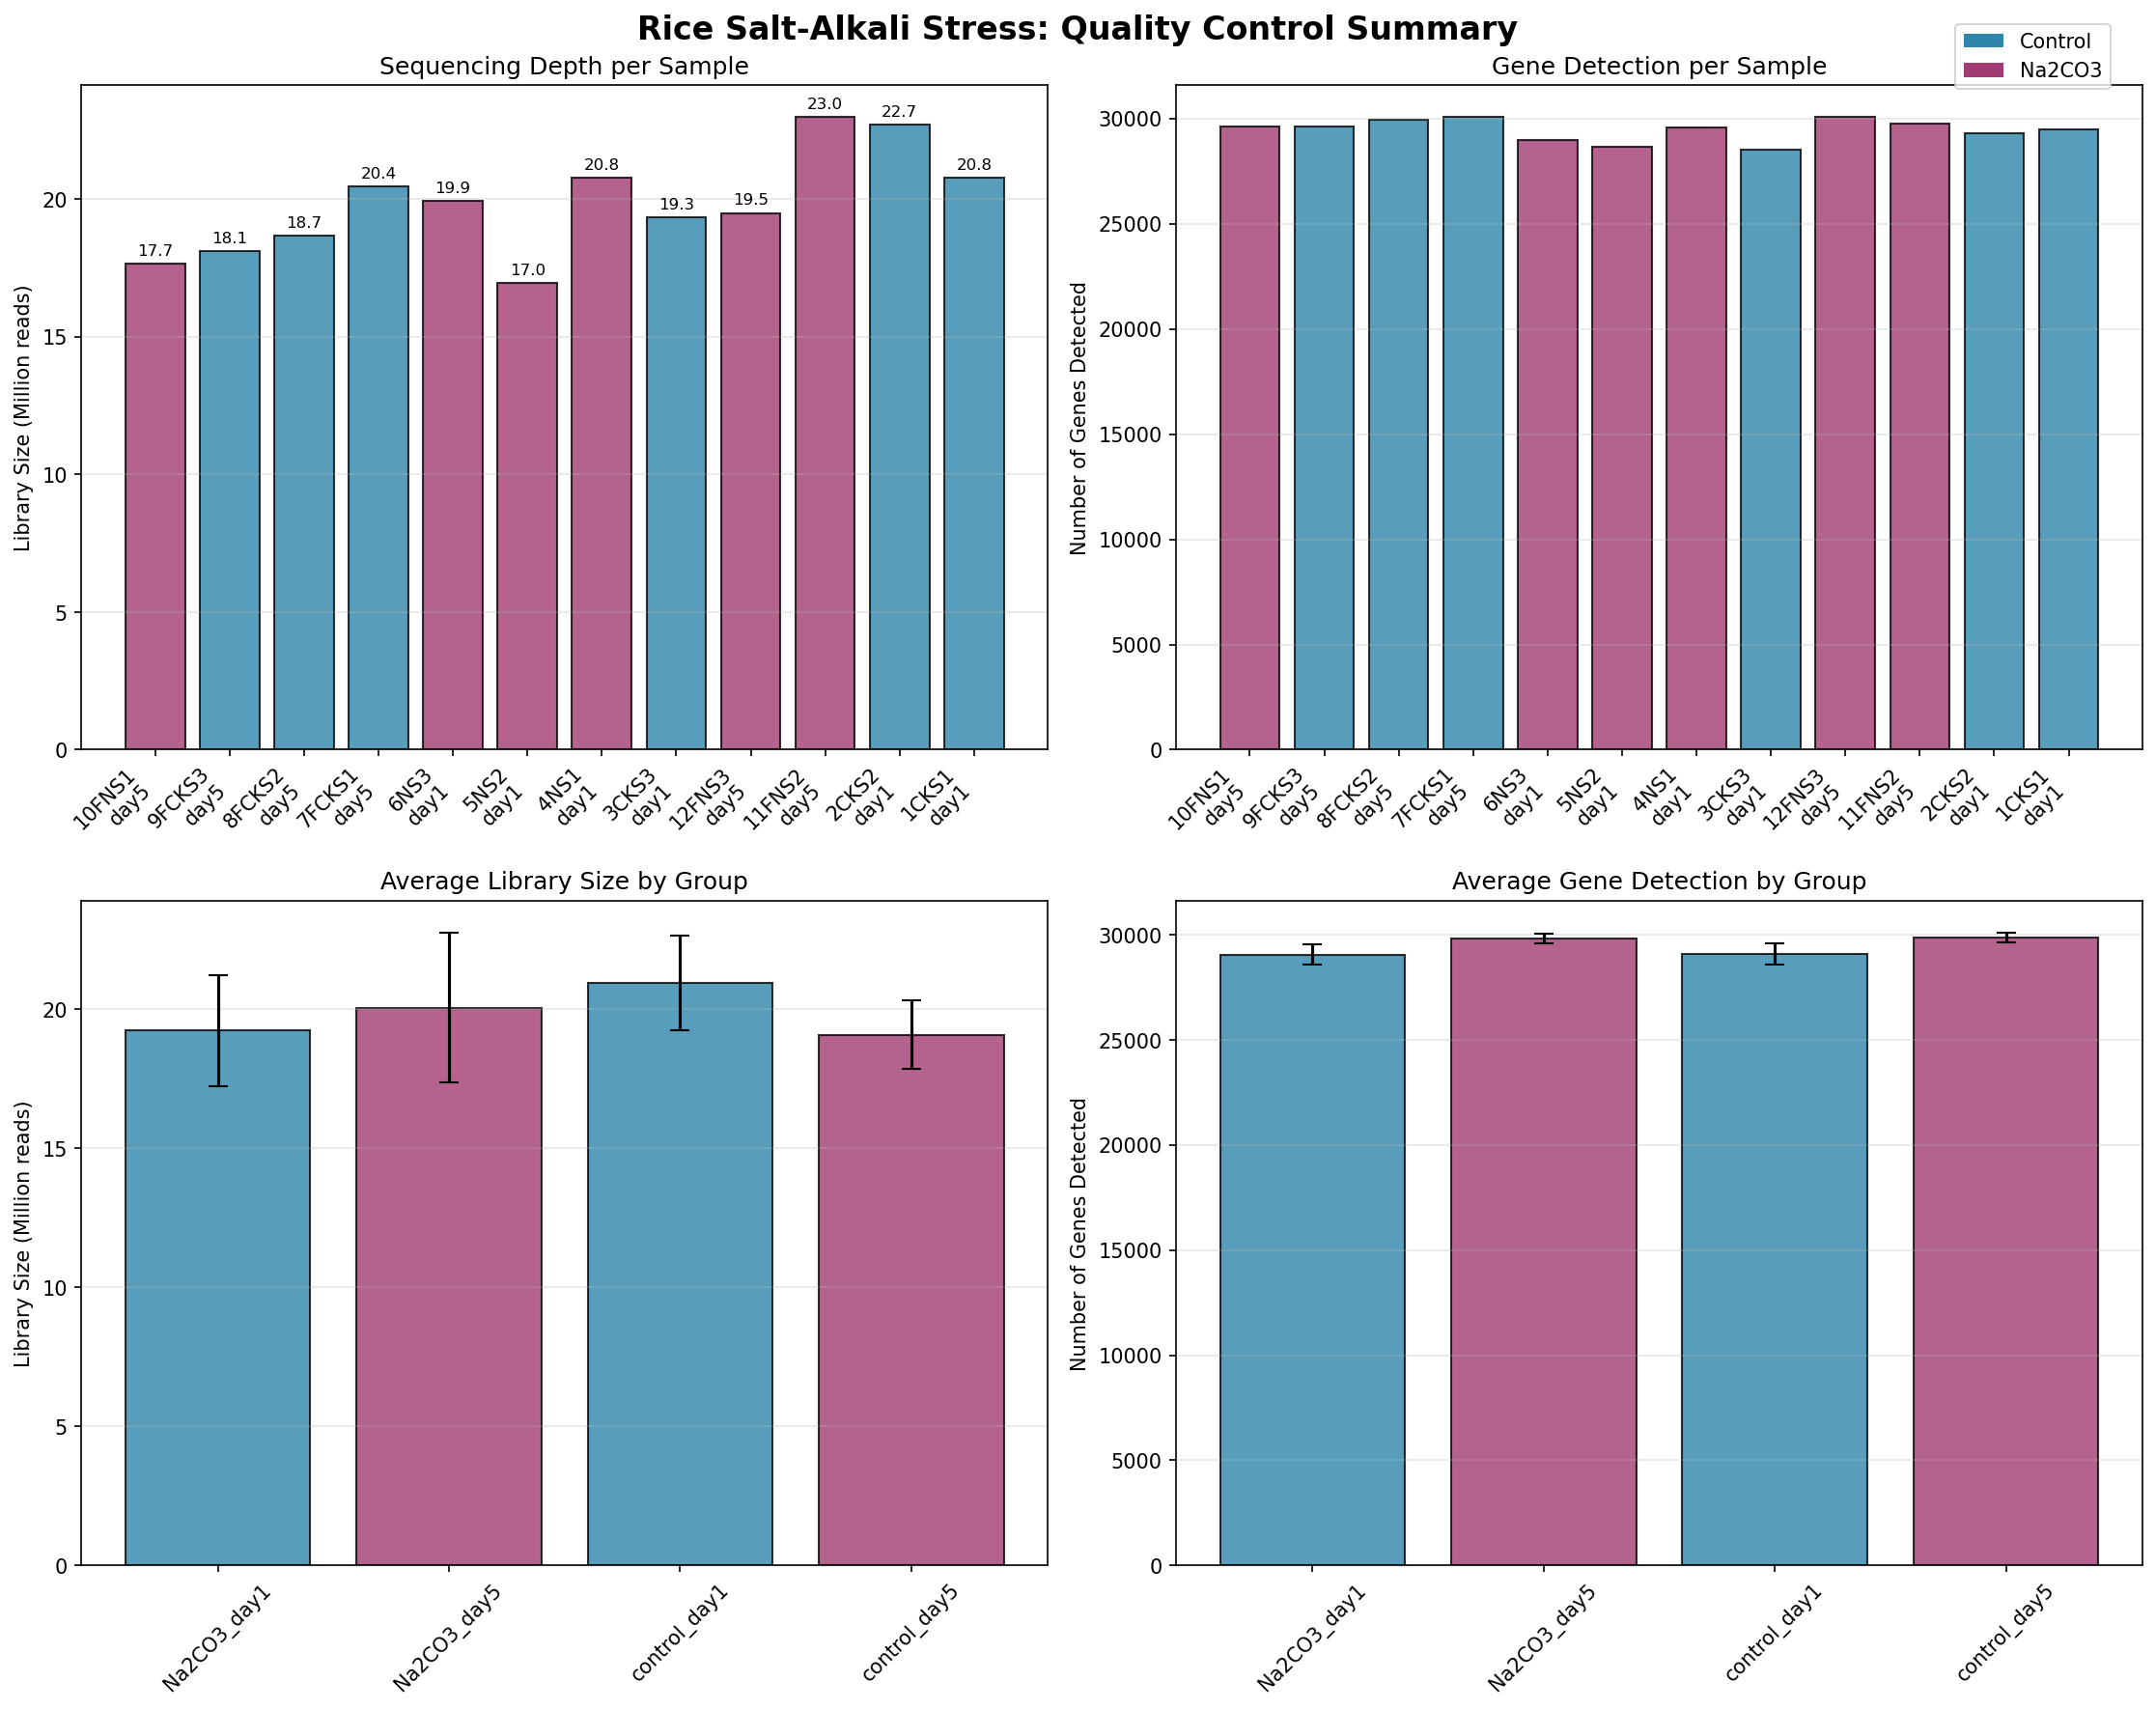
The report records a mean library size of 19.8 ± 2.0 million paired-end reads per sample, 29,456 ± 504 detected genes, 96–97% HISAT2 alignment, and more than 98% Q20 bases after trimming.
Both contrasts contained large, statistically supported changes
The reanalysis reproduced the direction of the time-dependent response
The publication and Pipette analysis both found more DEGs at Day 5 than Day 1 and a modest predominance of downregulation. Pipette returned fewer strict DEGs at both timepoints.
| Metric | Published study | Pipette analysis |
|---|---|---|
| Alignment rate | 95.24–95.94% | 96–97% |
| Day 1 DEGs | 1,780 | 1,451 |
| Day 5 DEGs | 2,315 | 2,005 |
| Day 5 : Day 1 ratio | 1.30 | 1.38 |
Software versions, reference annotations, filtering, and threshold implementation can change exact counts. The records do not isolate a single cause for the differences.
What this analysis cannot establish
- Each condition-by-timepoint group contains only three biological replicates.
- The source study sampled shoots from one salt-sensitive japonica cultivar; results should not be generalized to other tissues, stages, or rice populations.
- The cultivar-name discrepancy between the prompt and publication remains unresolved.
- The session does not independently reproduce the publication’s qRT-PCR validation.
- Enrichment-ready lists were exported, but the session does not present interpreted GO or KEGG results.
- The 331-gene overlap depends on the strict threshold and is not a complete map of shared biological regulation.
Reanalyzed from public data. The direction of the time-dependent response agrees with the publication, but the provenance mismatch and missing enrichment interpretation prevent describing the entire published analysis as reproduced.
Artifacts recorded in the Pipette session
The files below are recorded in the session inventory; only the preserved session PDF is published on this website.
count_matrix.csv38,993 genes across 12 samplesde_results_day1/Complete Day 1 DESeq2 result setde_results_day5/Complete Day 5 DESeq2 result setoverlap_genes_strict.csv331 genes significant at both timepointsgsea_ranked_day1.csvRanked genes for downstream analysissample_qc_table.csvRead depth, detection, and alignment metrics