Large-scale proteomic response mapping with a visible batch boundary
The dataset covers 172 compound perturbations, but drug identity and acquisition series are not fully separable. The workflow distinguishes modeled contrasts, visualization-only batch correction, and exploratory mechanism hypotheses.
Which proteomic response programs remain visible after accounting for technical structure?
The analysis compared each compound with DMSO, clustered continuous drug-response signatures, and summarized Hallmark pathway enrichment. Mechanism-of-action labels remain hypotheses rather than confirmed targets.
Which drugs produce broad or shared protein-abundance changes in HepG2 cells, and which apparent effects cannot be separated from batch or control structure?
| Source | jgmeyer/mississippi |
|---|---|
| Assay | HepG2 drug-perturbation DIA-MS proteomics |
| Samples | 1,232 total; 1,052 drug and DMSO samples in differential testing |
| Controls | 23 DMSO, 24 DFO, and 155 pooled QC samples |
| Features | 8,630 measured proteins; 7,559 tested in limma contrasts |
Missingness audit, batch-aware limma models, signatures, and enrichment
Broad response programs coexist with strong technical and biological confounding
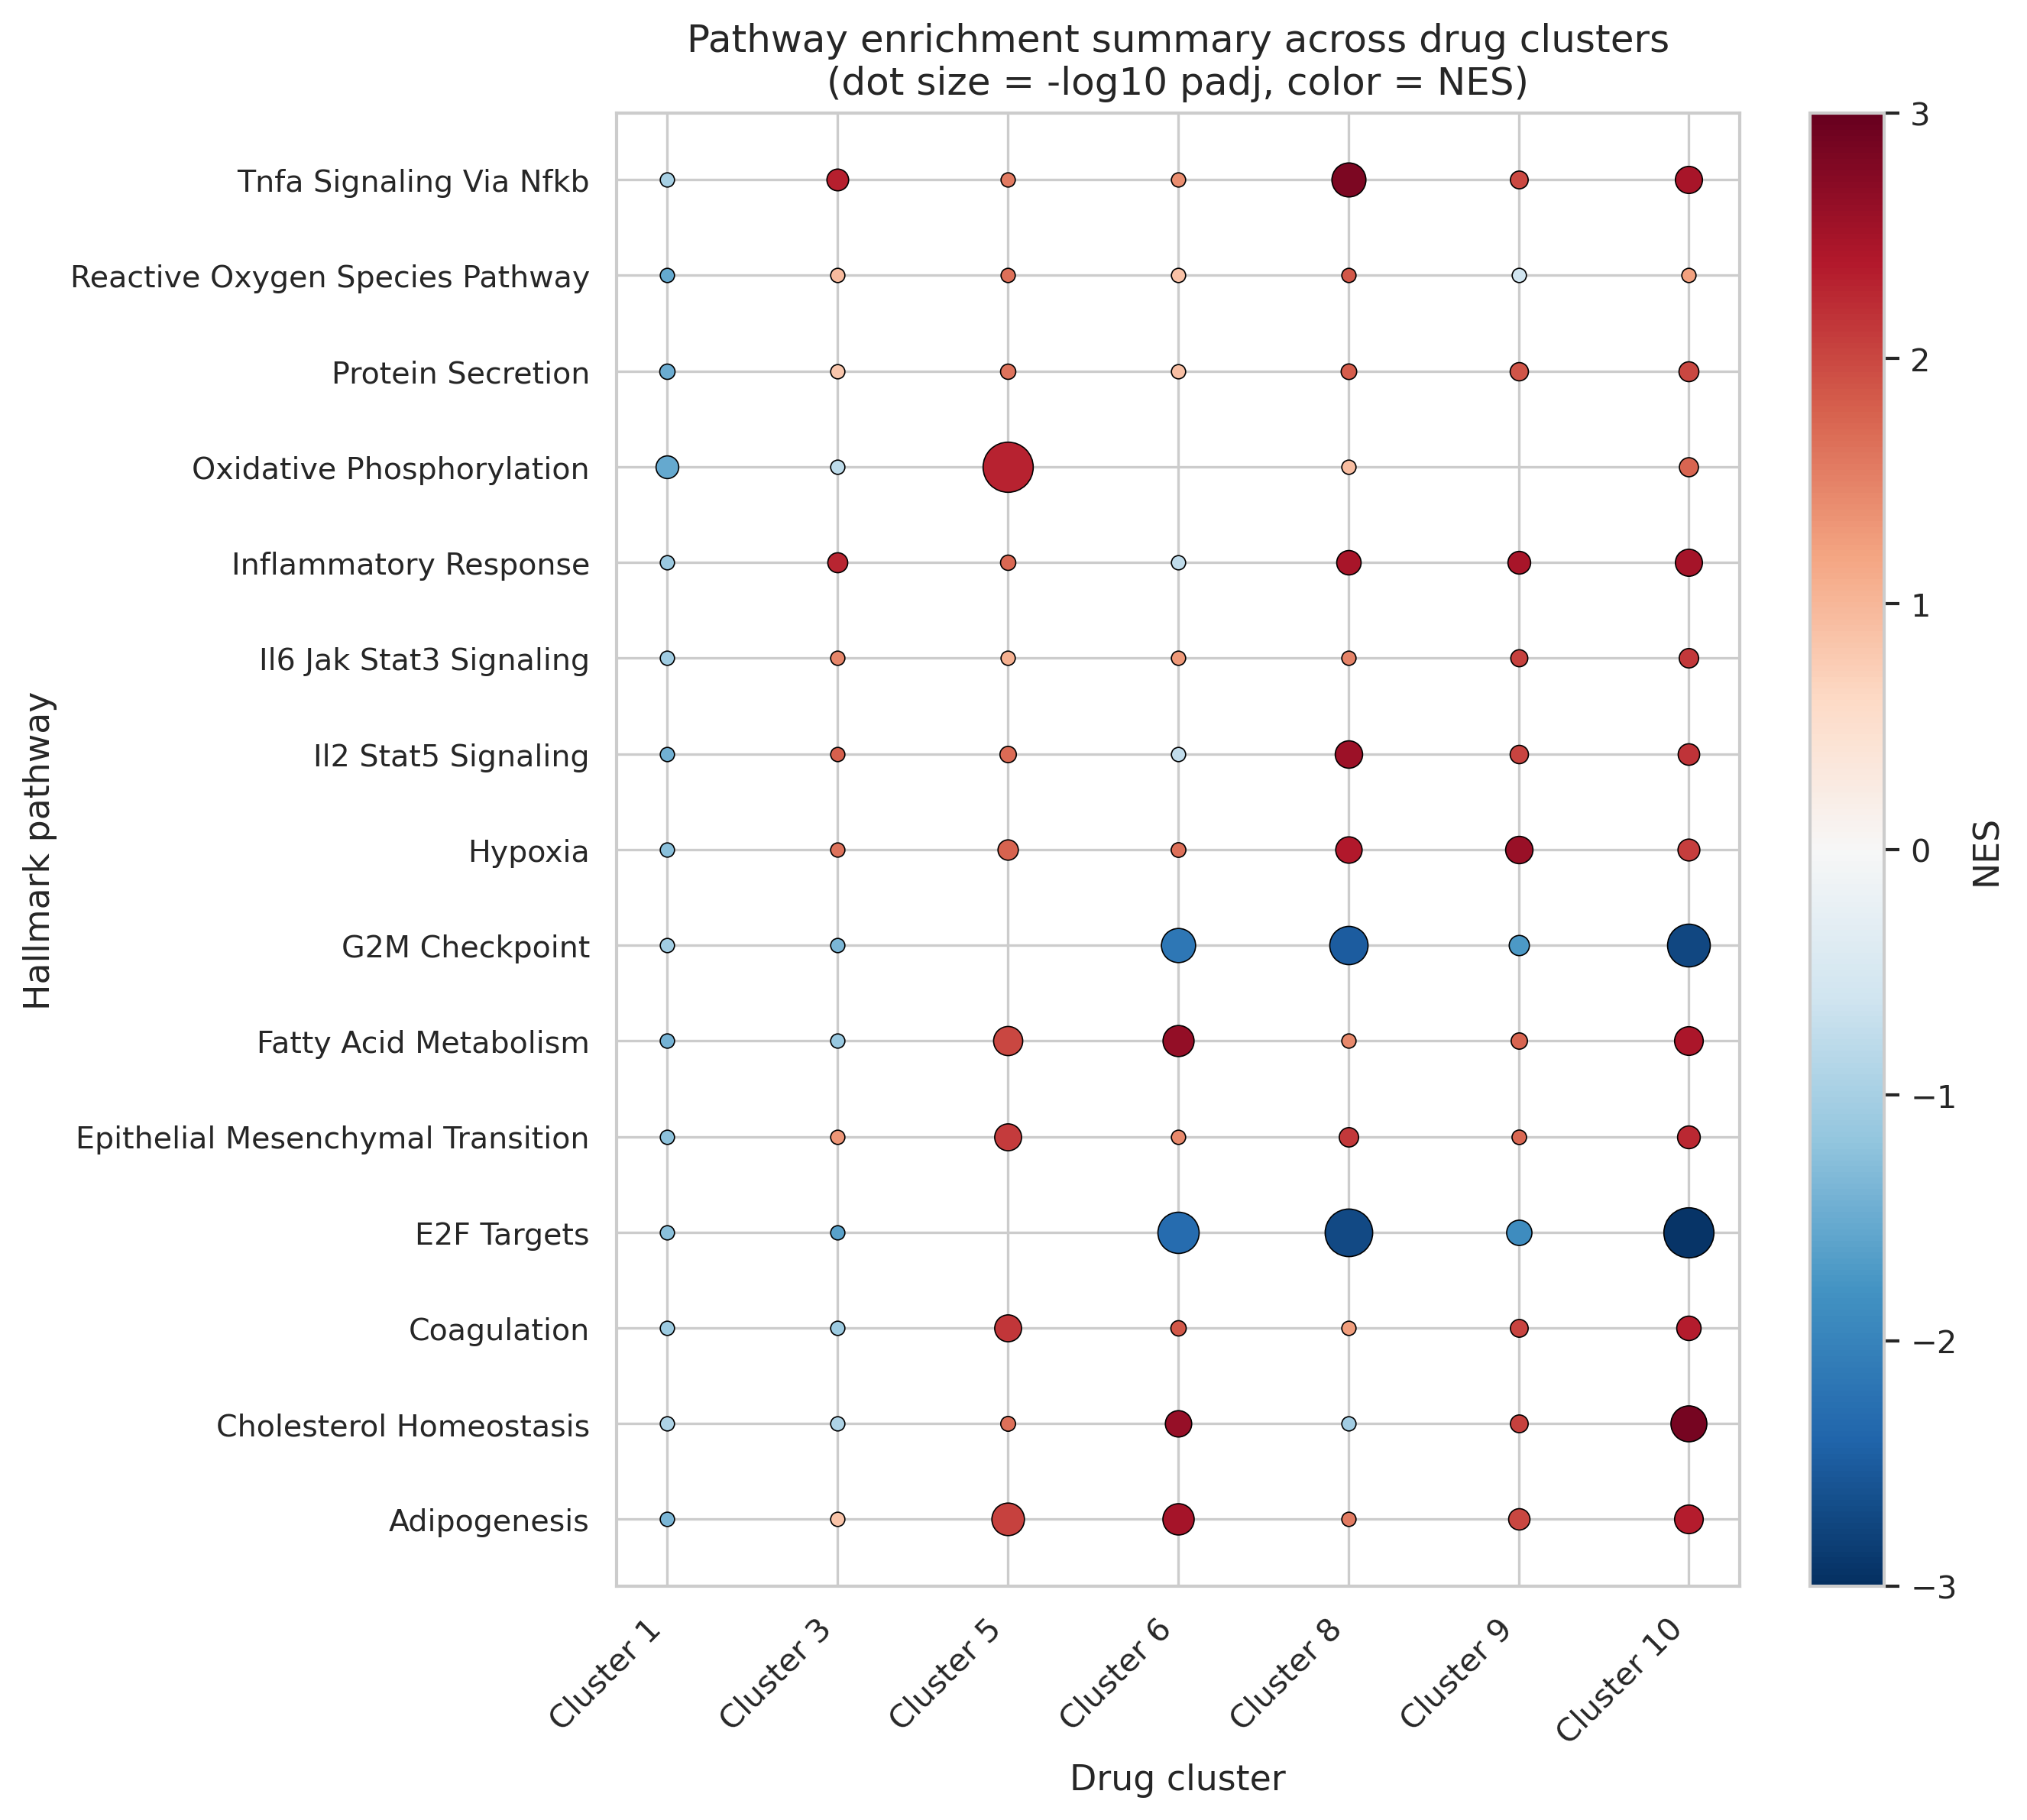
E2F_TARGETS and G2M_CHECKPOINT were downregulated across several signature clusters.
Eight non-RedMix drugs showed reproducibly low protein detection across most or all replicates.
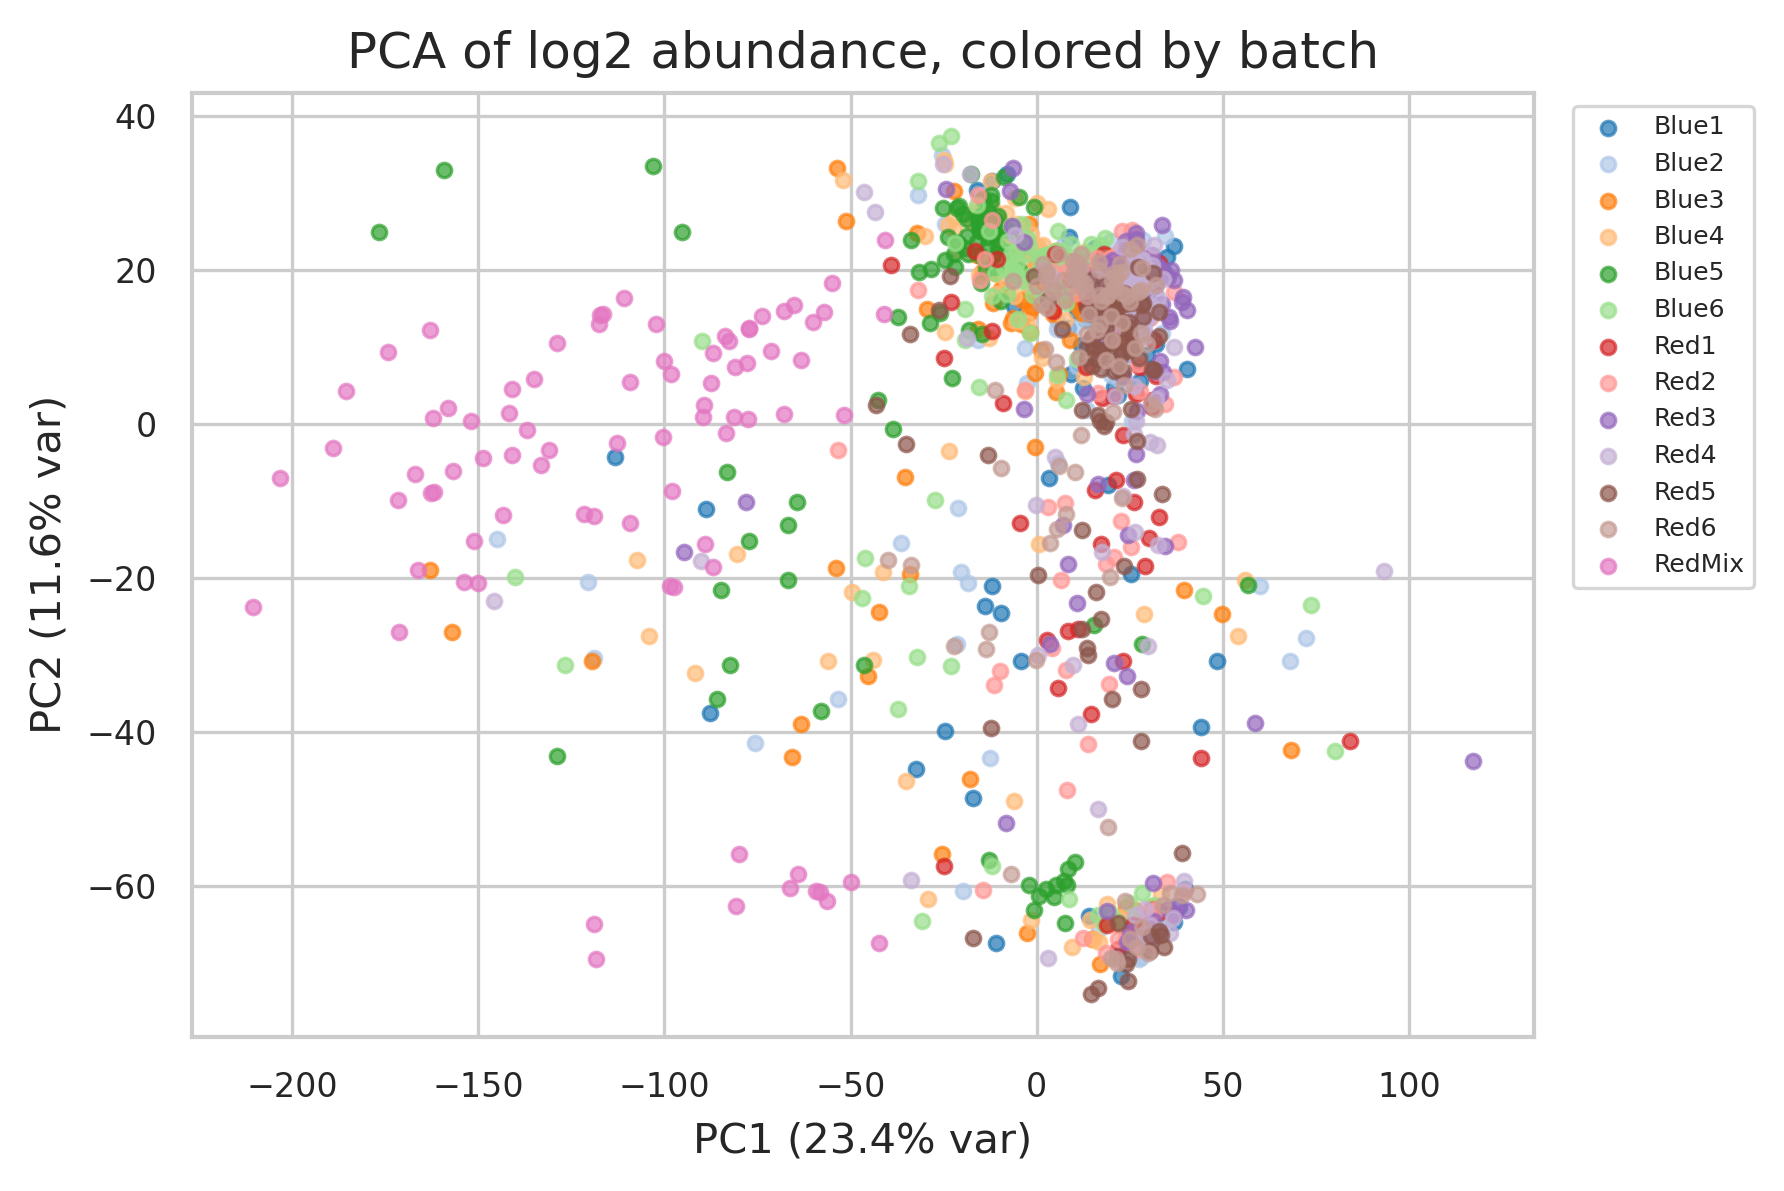
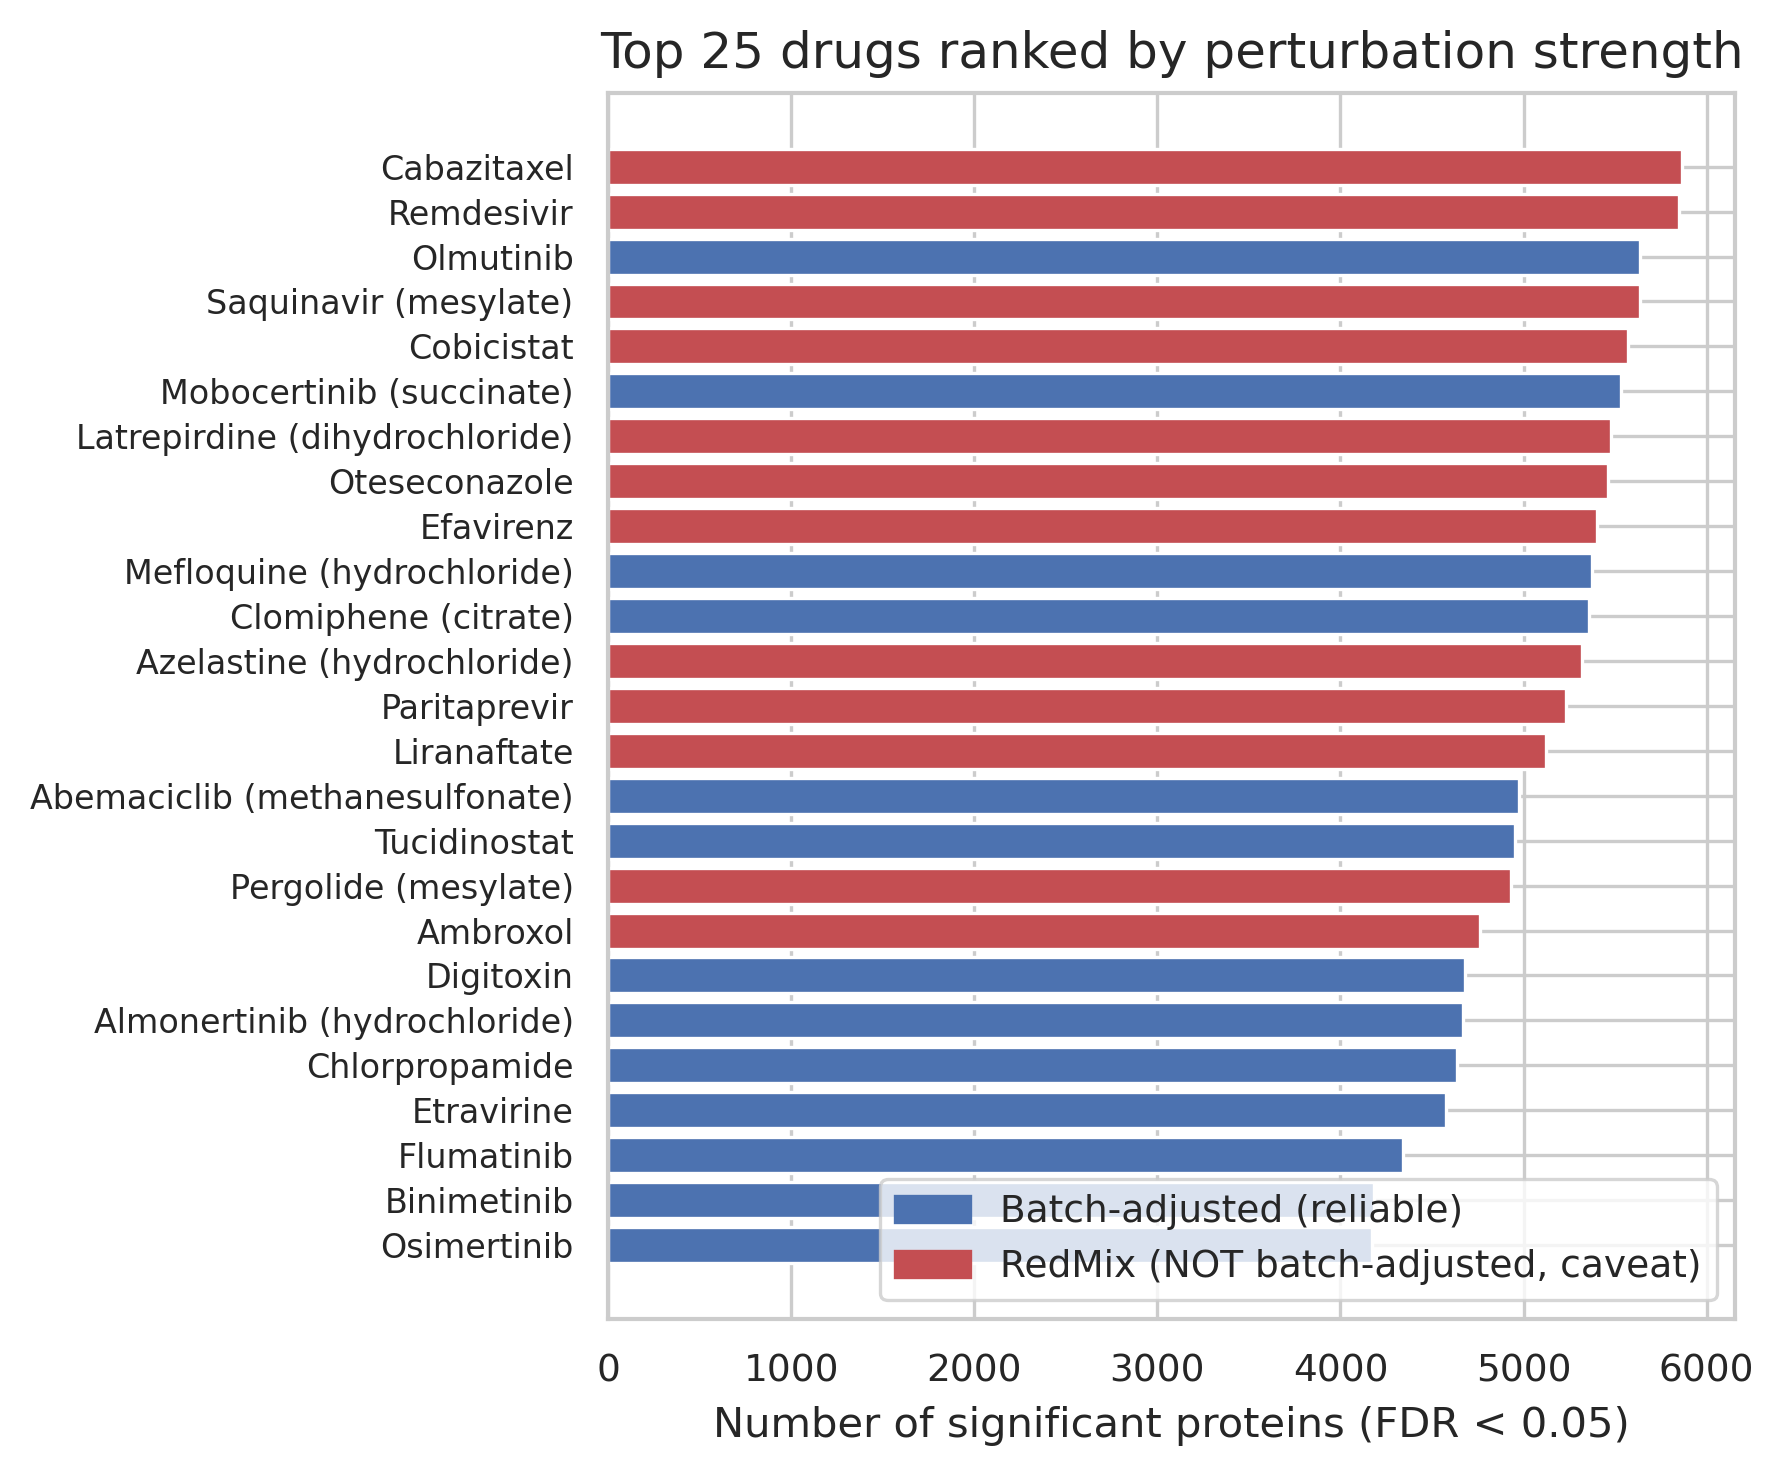
Twelve RedMix-only drugs lack an in-batch DMSO control, so drug and series effects cannot be separated.
Pan-drug stress candidates reflect broad response and are not validated drug-specific markers.
Batch, missingness, and design constrain mechanism claims
- Batch explains 59% of PC1 in the main PCA and drug identity is tied to acquisition series.
- The 12 RedMix-only compounds have no in-batch DMSO control, so their drug effects are not identifiable.
- Overall missingness is 10.6%; 758 proteins are missing in more than half of samples.
- The report does not provide a complete sensitivity analysis for imputation or missing-not-at-random behavior.
- Broad loss of detected proteins may reflect cytotoxicity or global proteome disruption rather than target-specific action.
- Signature similarity, pathway enrichment, and proposed biomarkers require external validation.
The non-RedMix contrasts support batch-aware response estimates. The analysis does not validate drug targets, causal mechanisms, clinical efficacy, or RedMix-only drug effects.
Artifacts recorded in the Pipette session
drug_vs_control_DE_results.csvPer-drug limma resultsdrug_perturbation_ranking.csvFDR-based response rankingdrug_signature_matrix_tstat.csvContinuous drug signaturespathway_enrichment_per_cluster.csvExploratory Hallmark resultsanalysis_flags.jsonMachine-readable limitationslimma_fit_objects.rdsFitted statistical models