An observational genotype–survival comparison with unadjusted estimates
The analysis describes survival differences among four KRAS groups. It does not establish that a KRAS allele causes the observed prognosis because clinical covariates and treatment histories were not included.
Final groups2,034 patients
Largest groupG12D, n = 865
Longest medianWT, 24.2 months
ModelKM + pairwise Cox
Do common KRAS variants mark different overall-survival distributions in PDAC?
The session used the MSK Pancreatic Cancer Study 2024 from cBioPortal and focused on the three most common KRAS codon-12 variants plus a KRAS wild-type comparison group.
How do unadjusted overall-survival distributions differ among G12D, G12V, G12R, and KRAS wild-type patients in the recorded cohort?
| G12D | 865 patients |
|---|---|
| G12V | 684 patients |
| G12R | 340 patients |
| KRAS wild type | 145 patients |
| Final four-group total | 2,034 patients |
Clinical and mutation joins, group assignment, Kaplan–Meier curves, and Cox models
Retrieve study tablesClinical, survival, and mutation records were collected from the cBioPortal study.
Assign KRAS groupsPatients were assigned to G12D, G12V, G12R, or wild type for the final comparison.
Estimate survivalKaplan–Meier curves and median overall survival were computed for the four groups.
Compare groupsA global log-rank test and pairwise univariable Cox models compared each variant with wild type.
Preserve discrepanciesStudy-level, mutation, survival, final-group, and figure-title denominators were retained as separate values rather than reconciled by assumption.
Model boundaryThe Cox estimates are univariable. Age, stage, therapy, resection status, performance status, and molecular covariates were not modeled.
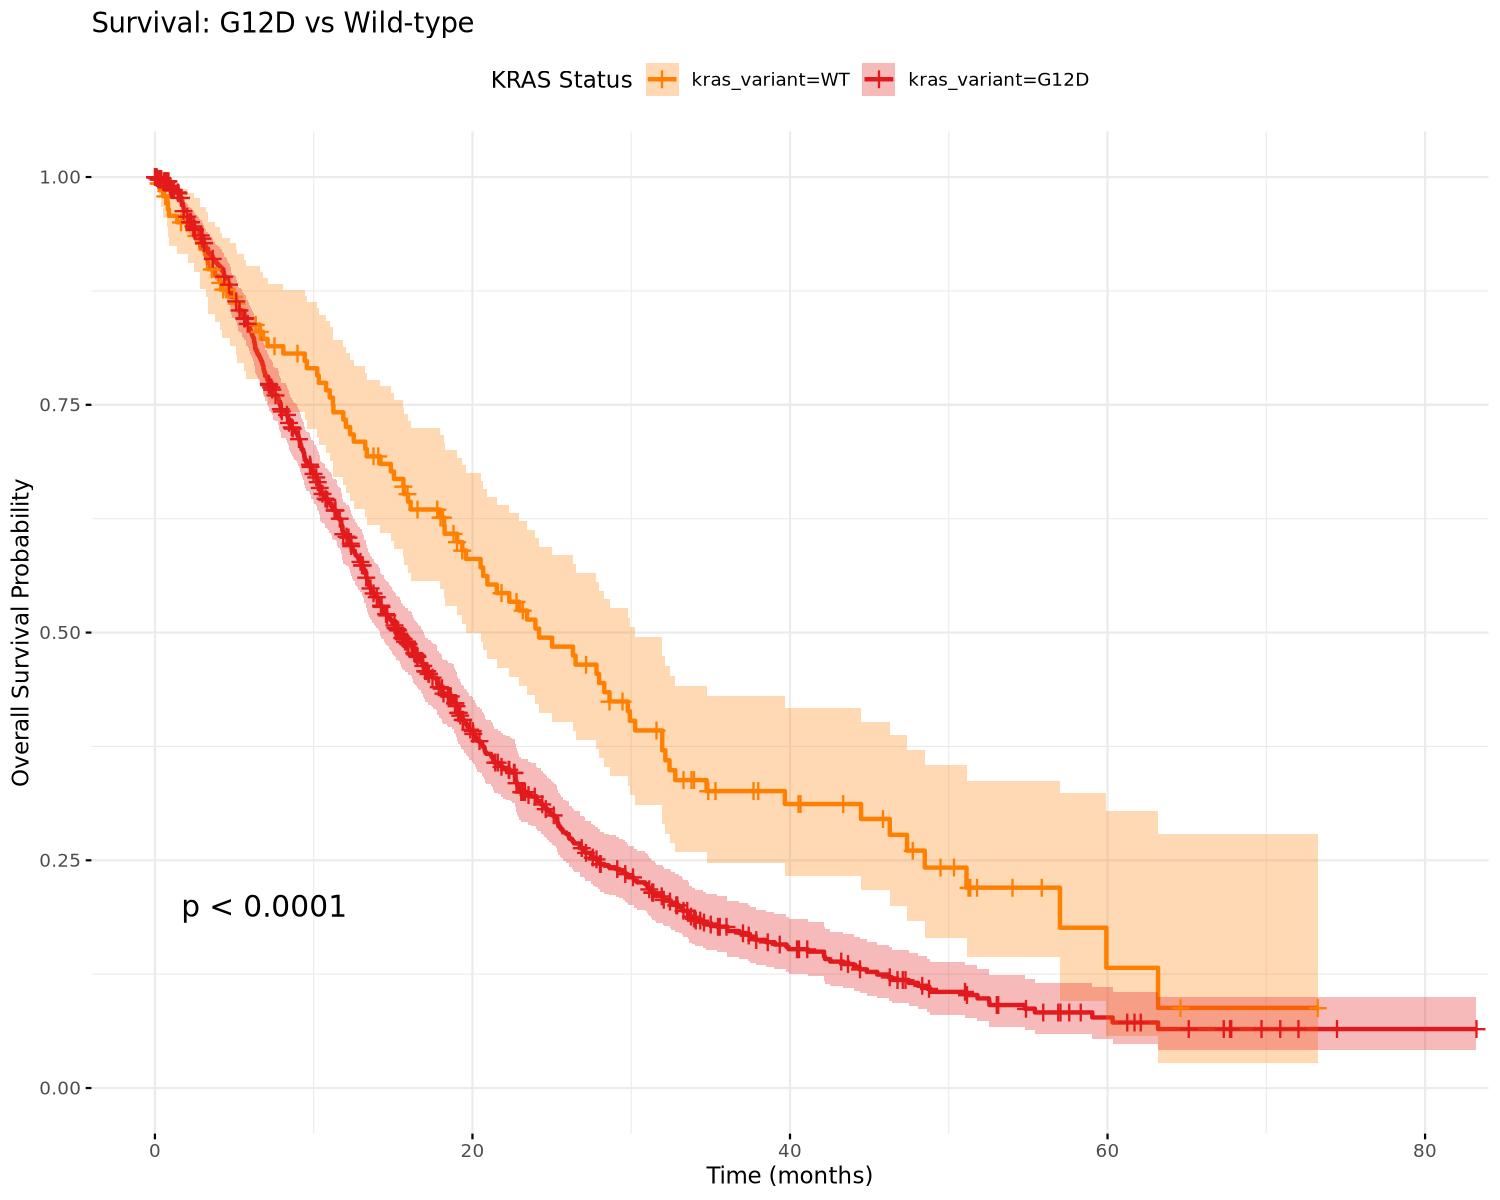
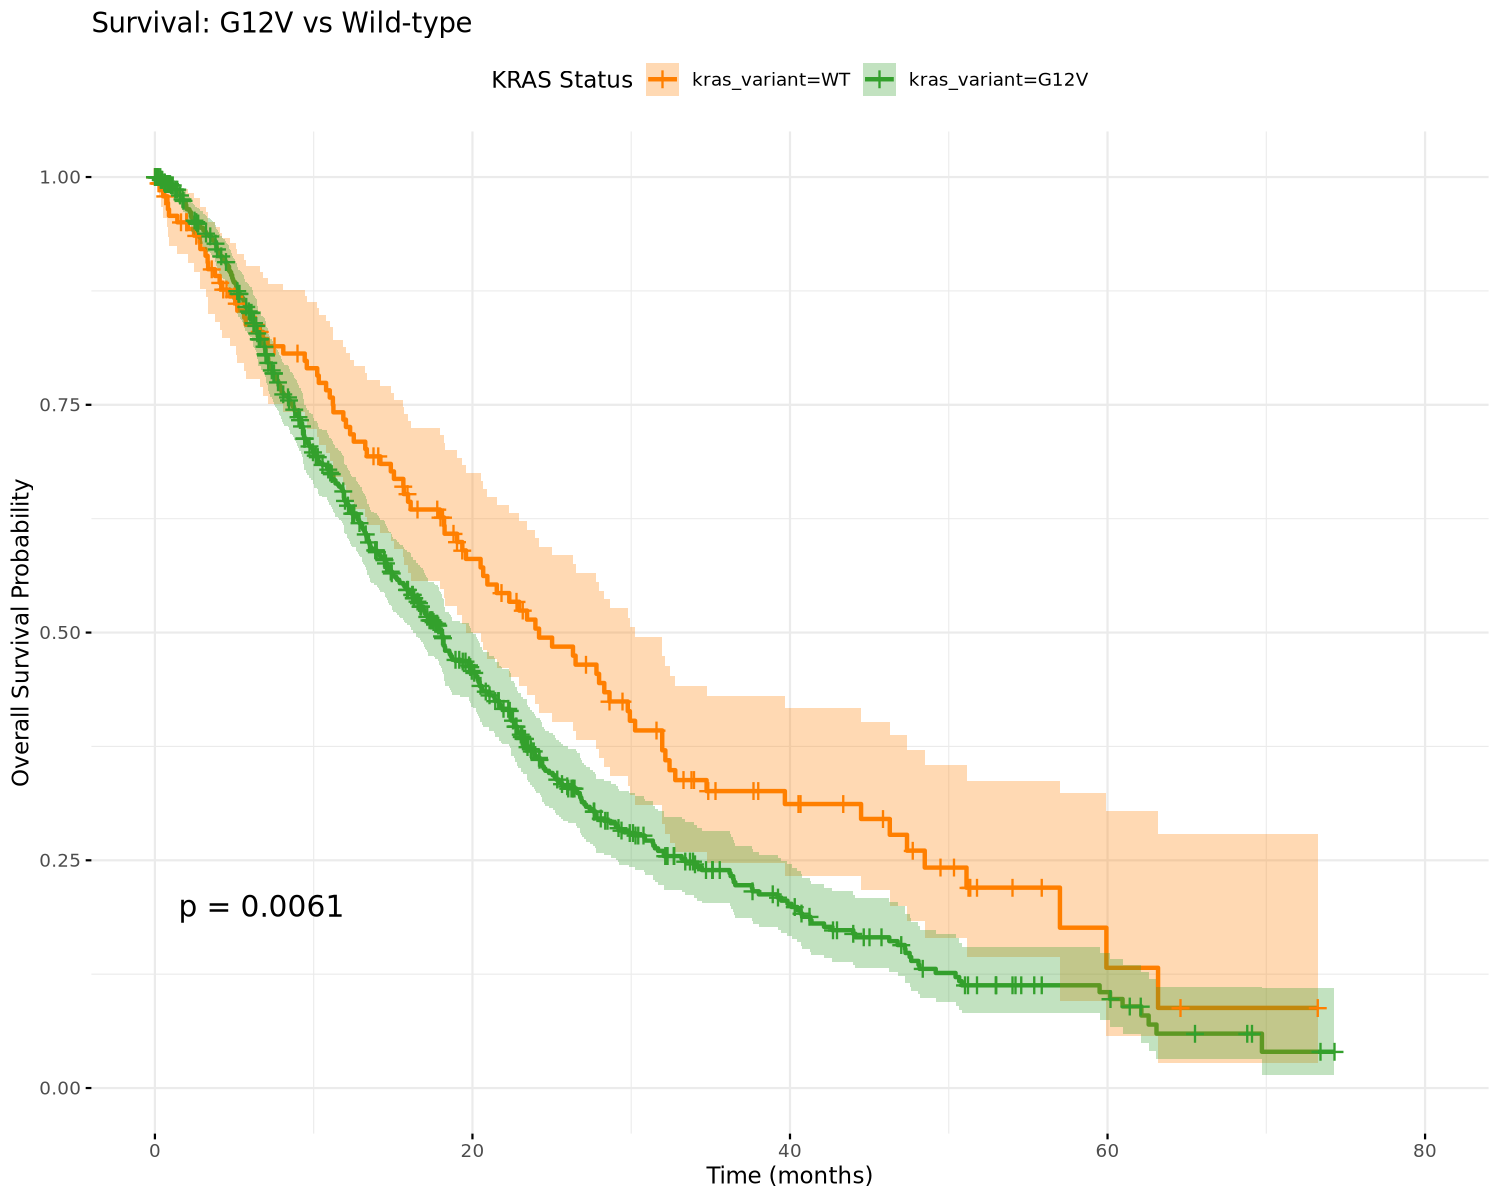
G12D had the shortest median survival and largest hazard ratio versus wild type
Median survival
WT 24.2 months; G12R 20.4; G12V 18.0; G12D 15.4.
G12D vs WT
HR 1.56, 95% CI 1.246–1.954, p = 0.0001.
G12V vs WT
HR 1.379, 95% CI 1.095–1.736, p = 0.0061.
G12R vs WT
HR 1.283, 95% CI 0.995–1.655, p = 0.0546.
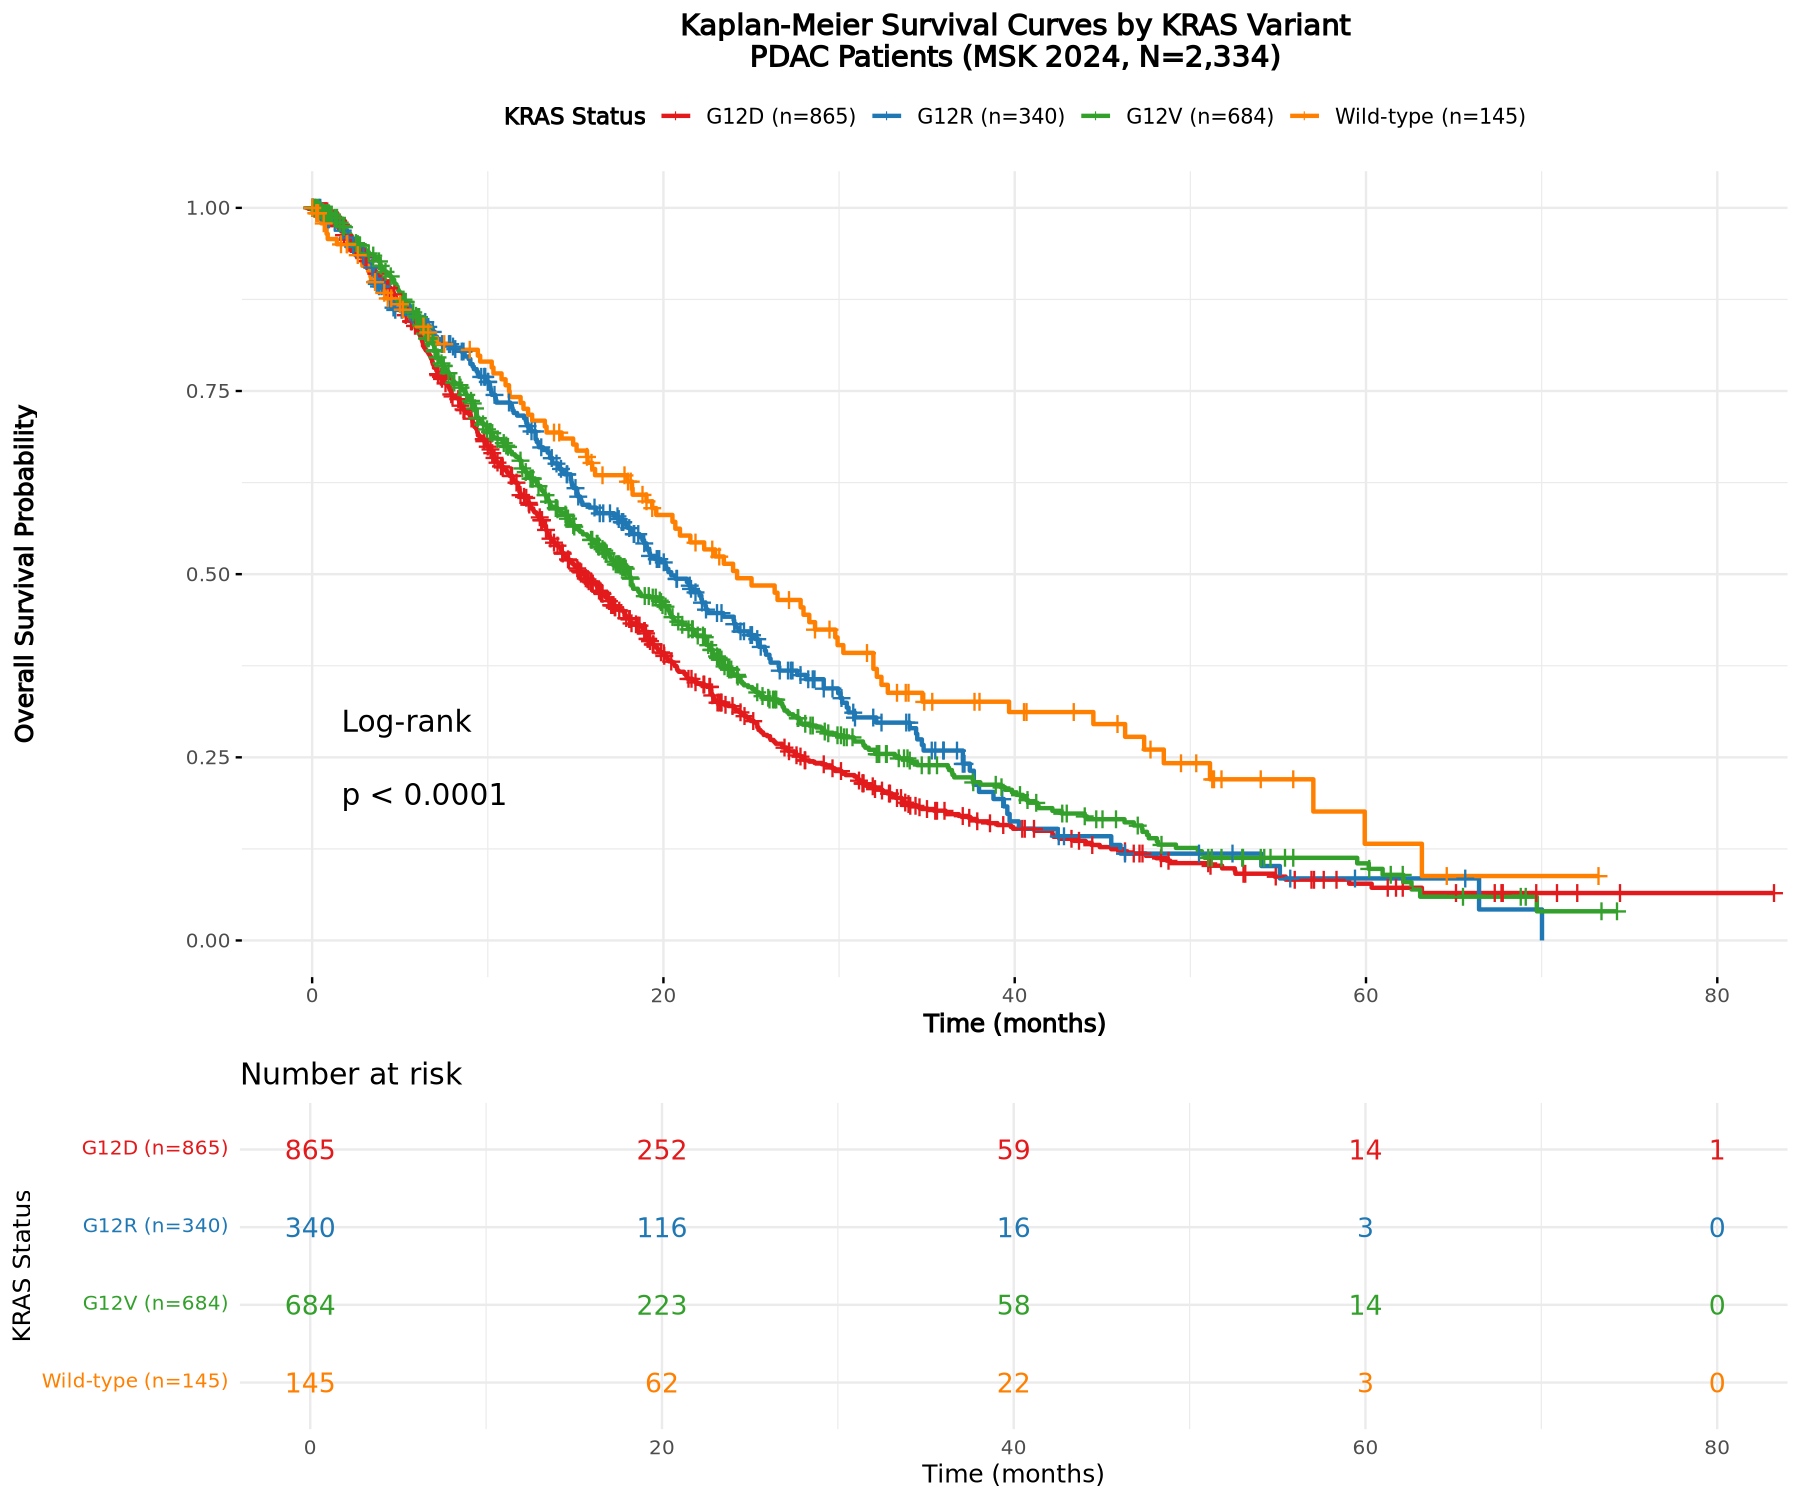
Confounding and inconsistent denominators prevent causal interpretation
- The report cites 2,336 study patients, 2,207 mutated patients, 2,270 patients with survival data, and 2,034 patients in the final four groups.
- The main Kaplan–Meier title reports N = 2,334, which does not match the final group total.
- The survival comparisons are unadjusted and observational.
- Clinical stage, treatment, surgery, comorbidity, and other genomic alterations may confound the estimates.
- The 145-person wild-type group is much smaller than the variant groups.
- No external cohort or prospective validation is documented.
Evidence boundary
The analysis supports an association between KRAS group and survival in the recorded comparison dataset. It does not prove a variant-specific causal effect or treatment recommendation.
Artifacts recorded in the Pipette session
clinical_data_msk2024.csvStudy clinical datasurvival_data_msk2024.csvOverall-survival fieldssurvival_analysis_dataset.csvJoined analysis-ready datasetkras_variant_summary.jsonVariant frequencies and group countsfinal_survival_summary.csvFour-group survival estimatespairwise_survival_results.csvHazard ratios and confidence intervalsOriginal Pipette session report10-page PDF · 703 KB · generated February 10, 2026. The HTML article is the primary case study; the PDF is the preserved session record.