A cell-atlas analysis with explicit QC and annotation boundaries
This is a cluster-discovery and marker-identification study, not a treatment-versus-control test. Donor and plate structure were reconstructed before the decision not to integrate batches.
Which transcriptionally distinct populations are present in the islet dataset?
The four donor and 32 plate identifiers encoded in cell barcodes were reconstructed and assessed before clustering. The objective was to find cell populations and their marker genes.
Which major and rare cell populations are supported by the GSE85241 expression matrix, and which clusters are better explained by technical artifacts?
| Source | NCBI GEO GSE85241 |
|---|---|
| Input | 19,140 genes × 3,072 CEL-seq2 cells |
| Sample structure | 4 donors × 8 plates × 96 wells |
| Objective | QC, clustering, working annotations, and per-cluster markers |
Count-integrity, QC, batch assessment, clustering, and markers
Major pancreatic populations were resolved—with one clear technical artifact
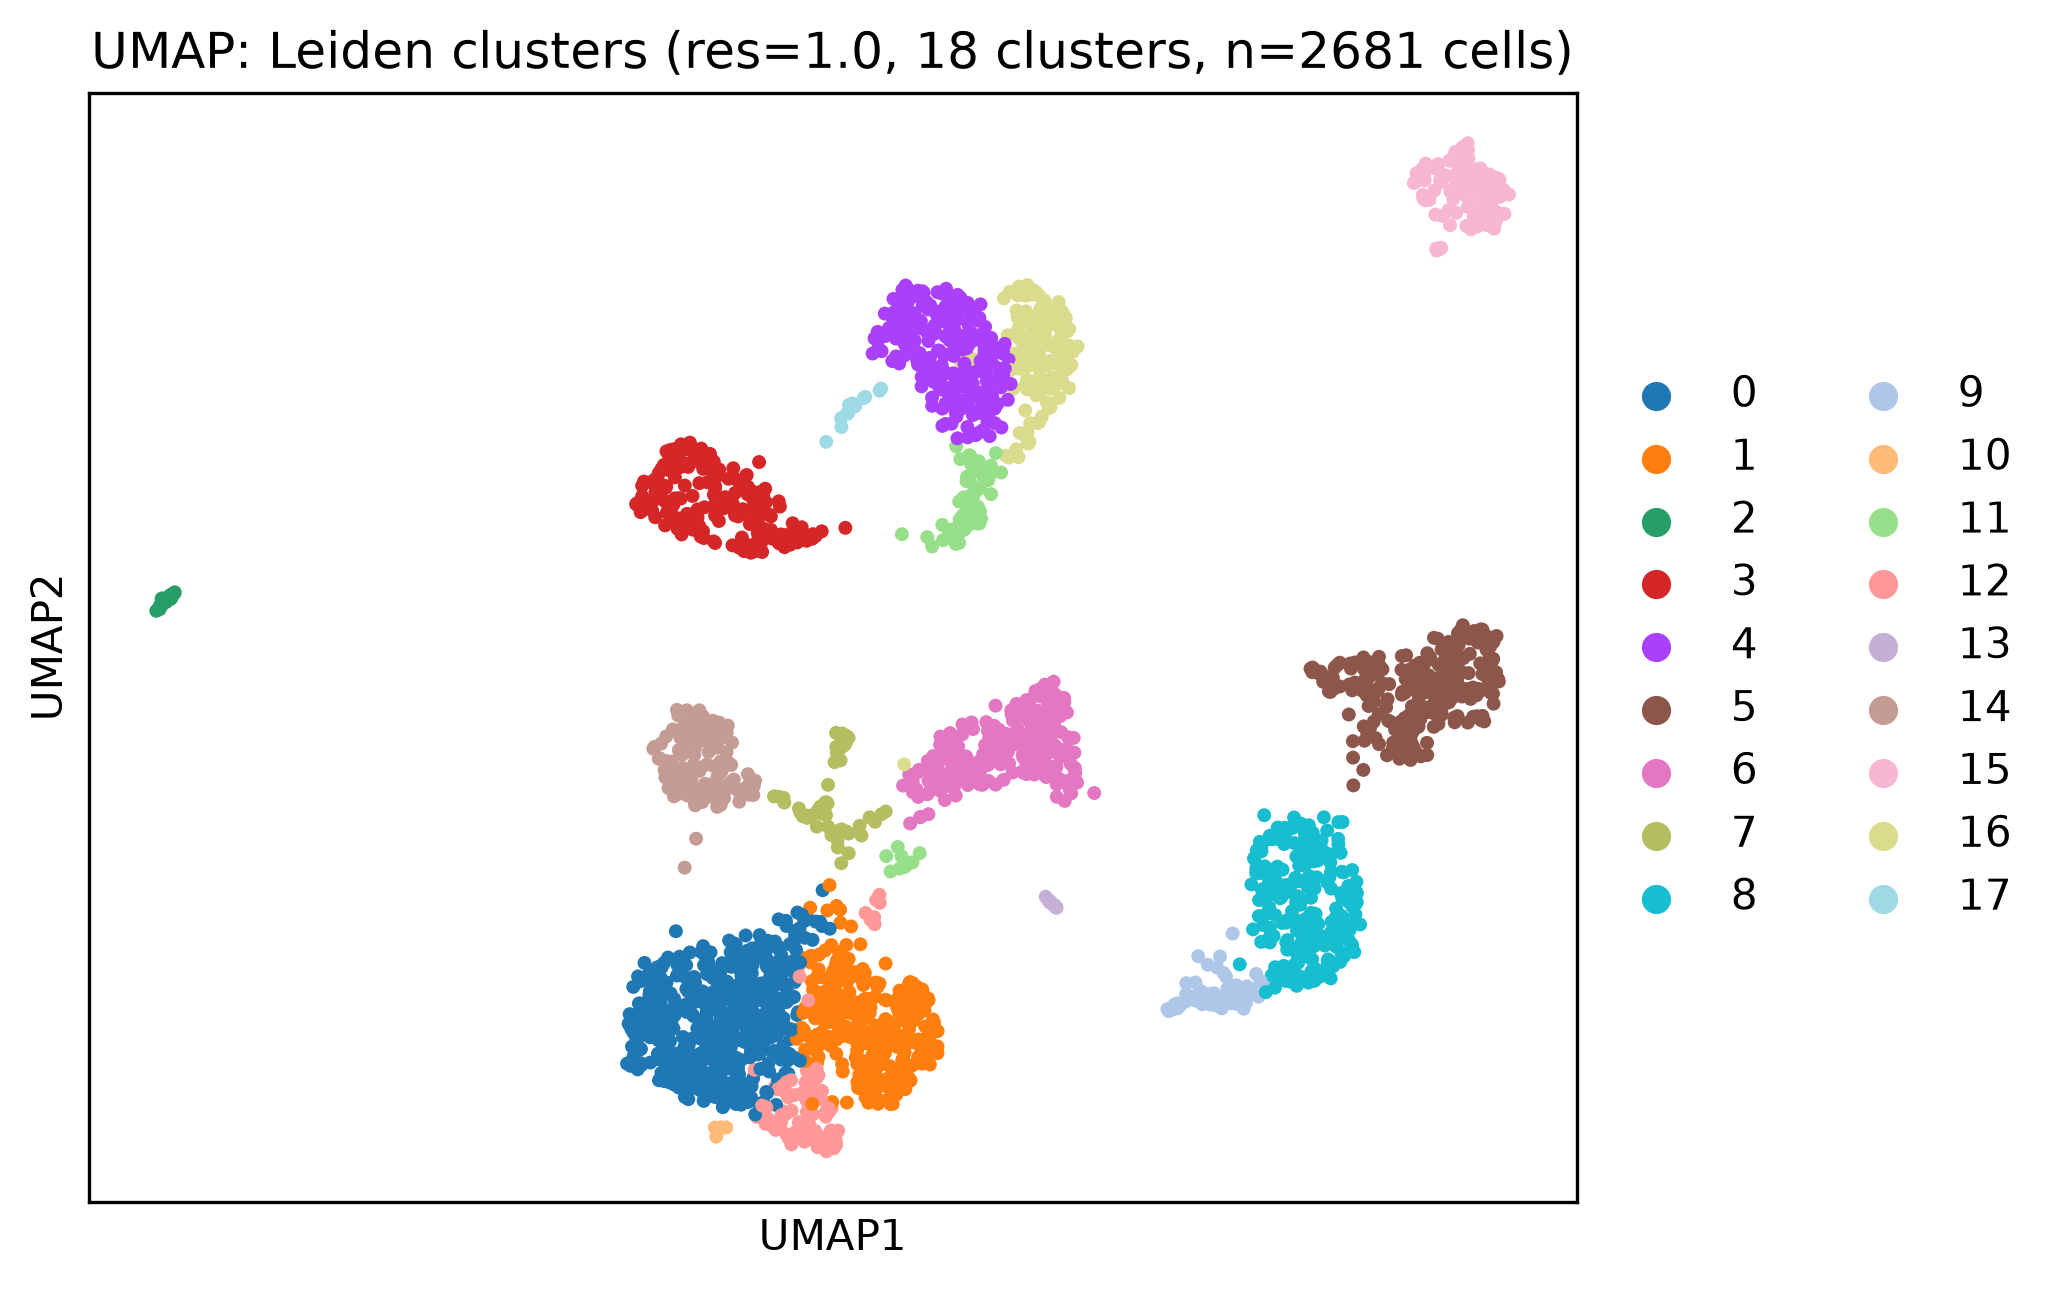
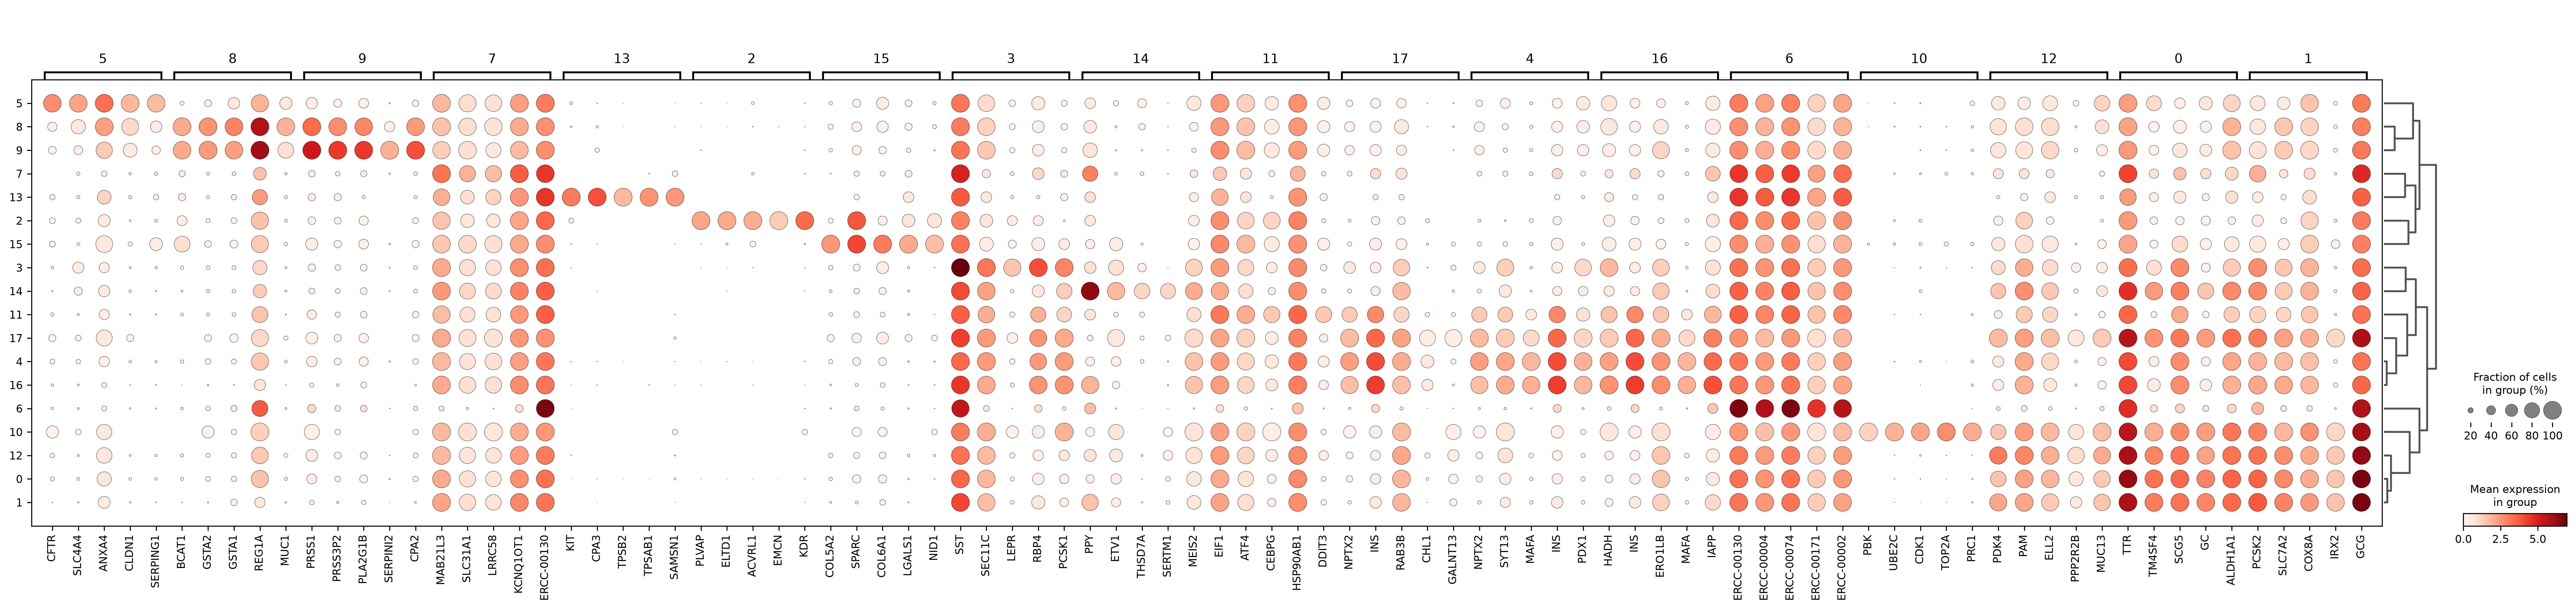
Marker profiles supported working annotations for alpha, beta, delta, PP/gamma, acinar, ductal, stellate, and endothelial populations. The run retained 36,833 significant marker gene–cluster associations after Bonferroni correction.
Large clusters carried canonical markers including INS, SST, PPY, PRSS1, CFTR, SPARC, and PLVAP.
Cluster 6 contained 247 low-complexity cells dominated by ERCC spike-ins and was not treated as a biological delta-cell population.
Cluster 13 contained 10 KIT/CPA3/TPSB2-positive cells consistent with candidate mast cells, pending validation.
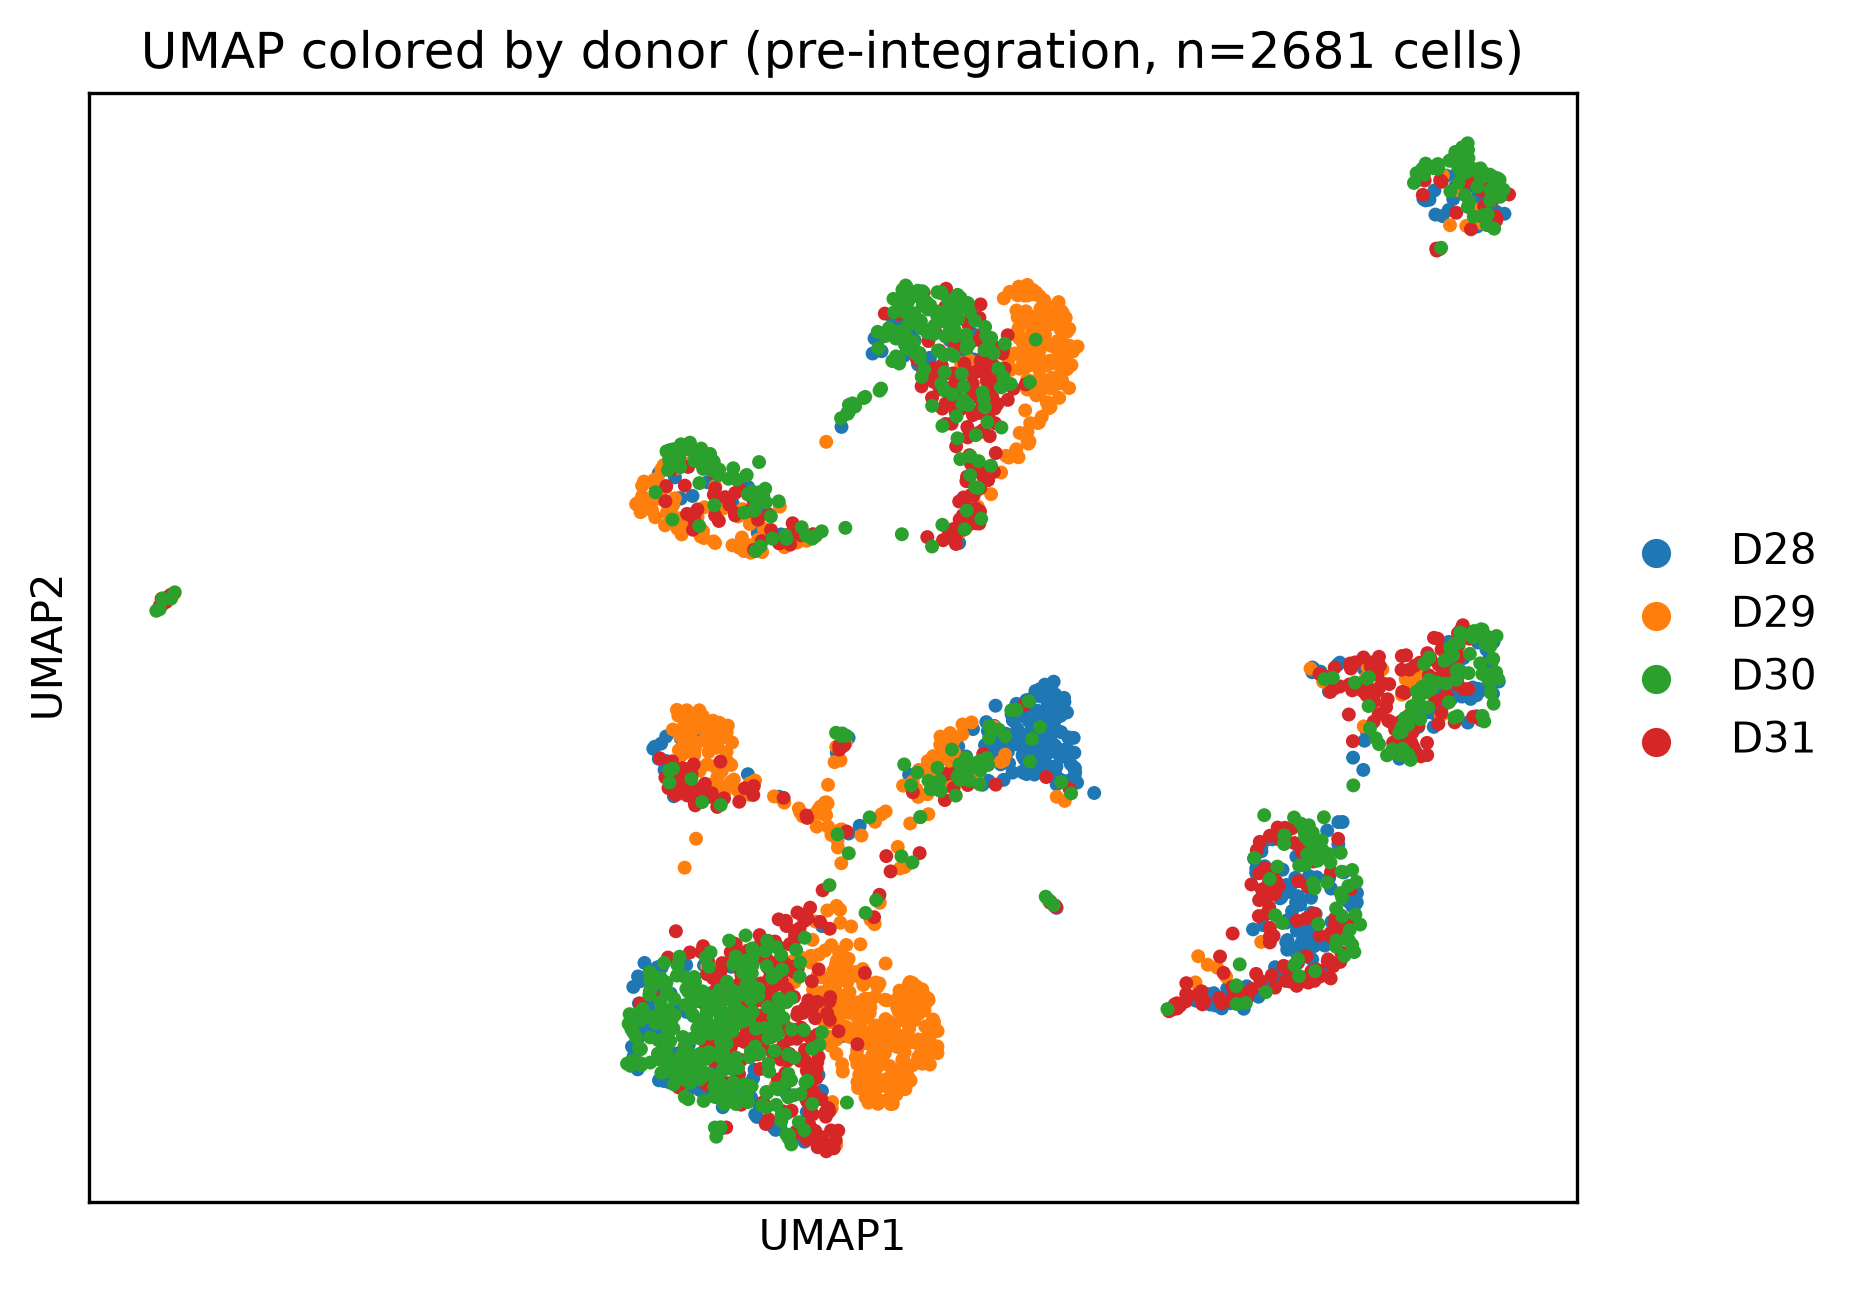
Donor identity did not dominate the leading PCs, so clustering used the uncorrected representation.
Working labels and QC decisions remain hypotheses to review
- The matrix contains collision-corrected, non-integer counts rather than raw molecule counts.
- No mitochondrial genes were available, so a conventional mitochondrial-fraction QC gate could not be applied.
- Several small clusters are ambiguous and the 10-cell mast-cell cluster needs orthogonal validation.
- Marker-dictionary annotations are working labels, not reference-mapping or experimental confirmation.
- The dataset has no treatment contrast; cluster markers should not be described as differential treatment responses.
- Skipping integration is a documented choice, not proof that all plate-level effects are negligible.
The report supports a cluster atlas with marker-based working labels. It does not support definitive discovery of a new cell type or disease mechanism.
Artifacts recorded in the Pipette session
adata_raw.h5adImported expression matrixadata_qc.h5adQC-filtered cells and genesadata_clustered.h5adEmbedding, clusters, and annotationscluster_markers.csv36,833 significant marker associationscluster_annotations.csvWorking labels and match scoresanalysis_flags.jsonMachine-readable caveats