A factorial tomato RNA-seq analysis with an exploratory network follow-up
The session starts from public paired-end FASTQ files, reconstructs four experimental groups, and tests pathogen, JCK1241, and interaction effects in one DESeq2 model. A second query uses the same expression data for exploratory WGCNA, module–trait testing, resampling, and functional enrichment.
Does JCK1241 change the tomato transcriptional response to infection?
The public dataset profiles tomato plants exposed to Ralstonia solanacearum, JCK1241, both treatments, or neither. The four groups make it possible to distinguish the infection response, the standalone JCK1241 response, and the non-additive interaction between them.
Scientific question
Which tomato genes and pathways respond to infection, and does JCK1241 amplify, attenuate, or otherwise alter that response?
| Organism | Solanum lycopersicum (tomato) |
|---|---|
| Public dataset | GEO GSE306380 / BioProject PRJNA1309269 |
| Samples | 12 paired-end RNA-seq libraries |
| Design | Control, pathogen, JCK1241, and pathogen + JCK1241; three biological replicates per group |
| Primary model | DESeq2: pathogen + JCK1241 + pathogen:JCK1241 |
| Primary contrast | Pathogen × JCK1241 interaction |
What was asked of Pipette?
Start from raw SRA FASTQ files; verify the four-group design and input-size gate; run read QC and gene-level quantification; test pathogen, JCK1241, and interaction effects; perform ranked enrichment; and interpret whether JCK1241 primes, amplifies, suppresses, or creates a distinct transcriptional response.
The experiment measures tomato transcript abundance at one timepoint. It does not measure pathogen titre, protein abundance, metabolites, disease severity, or yield, so it cannot establish whether JCK1241 directly changes host signaling or indirectly changes the apparent response through infection severity.
FASTQ → QC → Salmon → DESeq2 → ranked KEGG enrichment → WGCNA
The analysis retained the factorial design throughout quantification and differential expression, then reused the normalized expression matrix for a separate exploratory co-expression analysis.
The infection response dominated, while JCK1241 altered thousands of infection-responsive genes
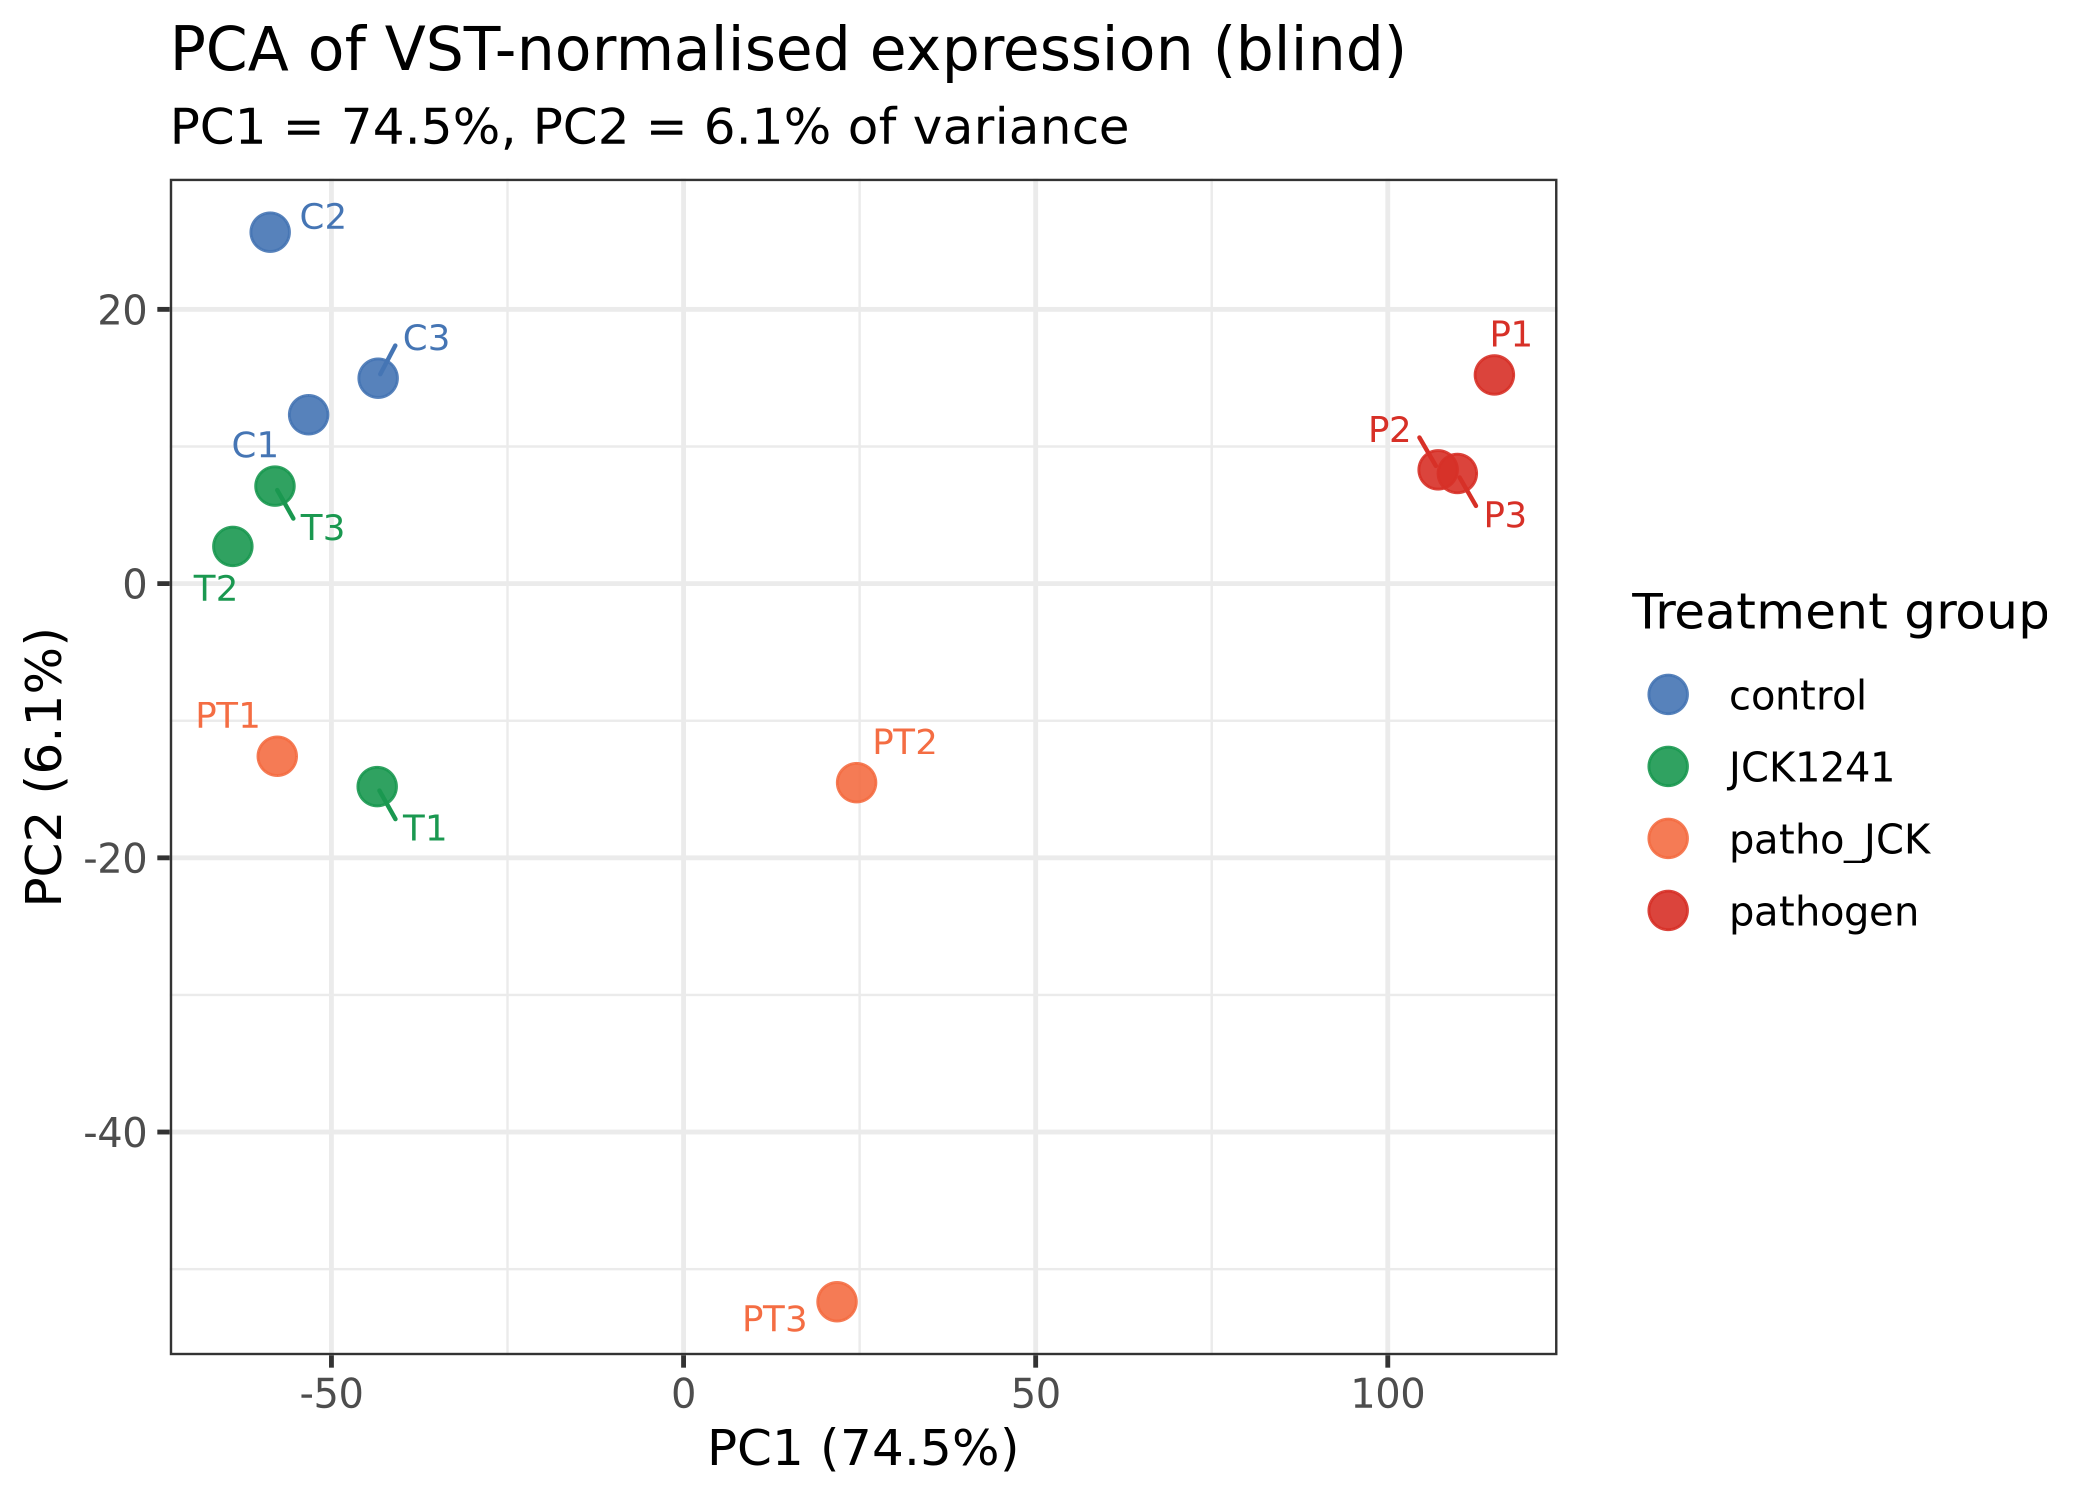
PC1 captured 74.5% of expression variance and separated infected from non-infected plants. JCK1241 alone produced a smaller response, while the interaction term identified extensive non-additive expression changes in the combined condition.
The pathogen main effect contained 4,925 upregulated and 5,373 downregulated genes at FDR < 0.05.
The JCK1241 main effect contained 241 upregulated and 126 downregulated genes at FDR < 0.05.
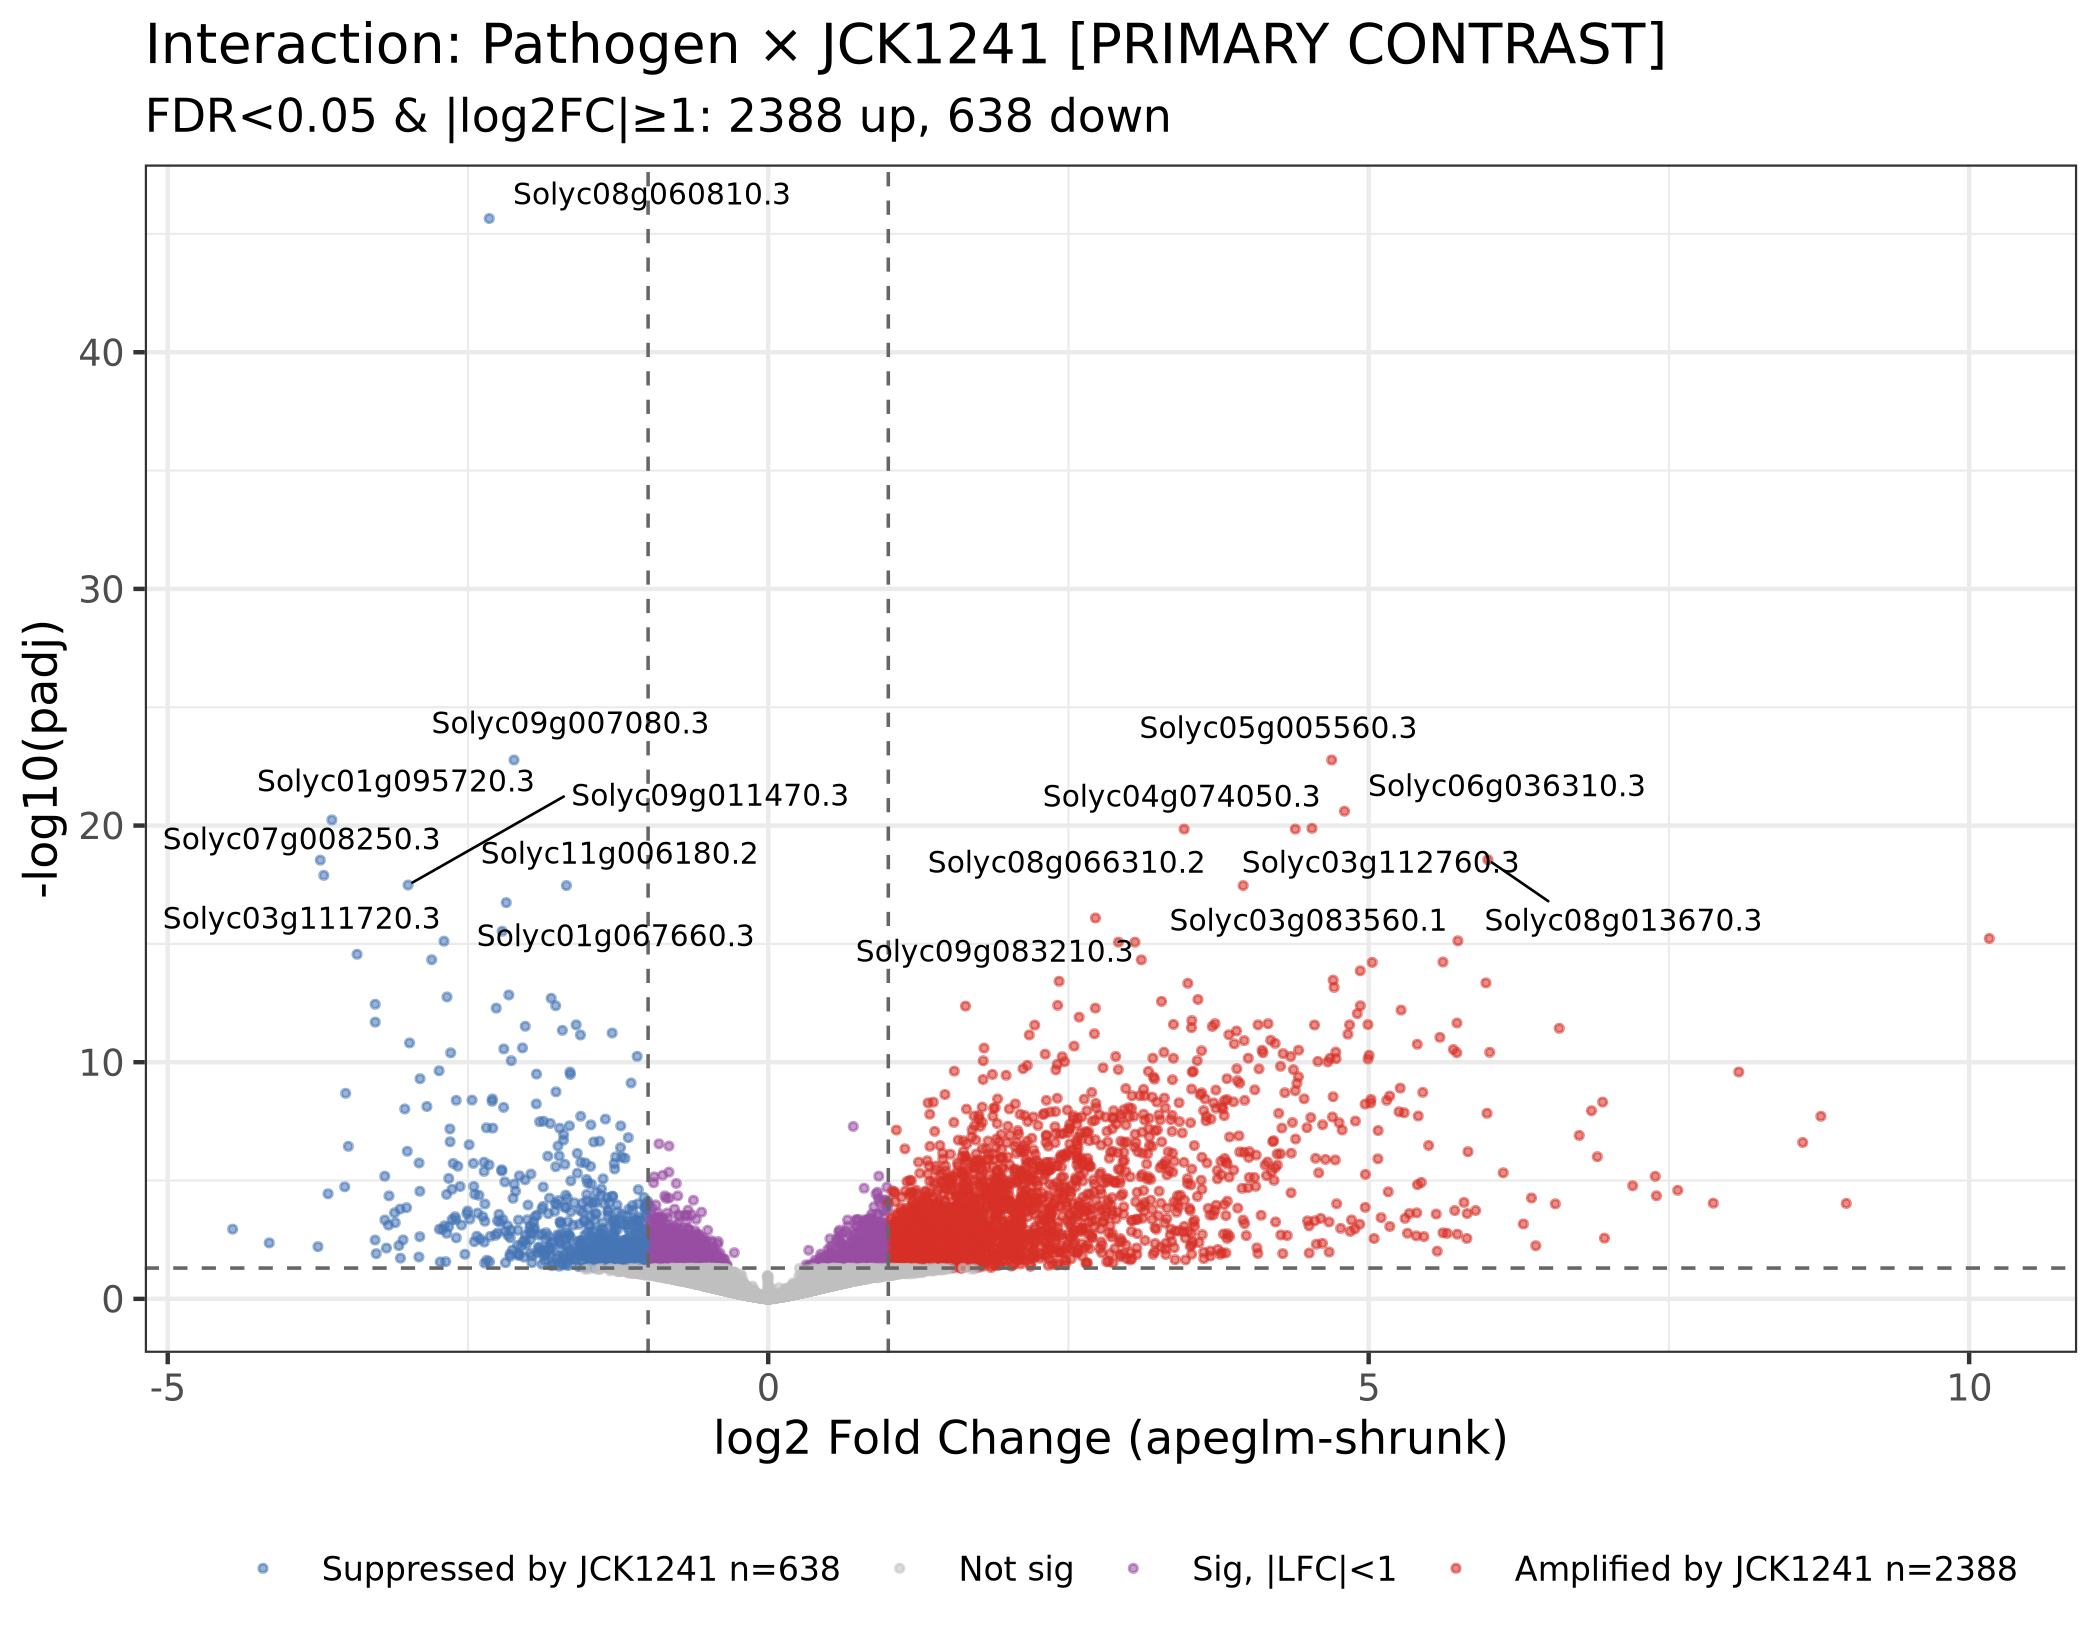
The primary pathogen×JCK1241 term contained 3,067 positive and 1,441 negative interaction effects at FDR < 0.05.
4,152 of 4,508 interaction-significant genes were also pathogen-responsive, placing most JCK1241 modulation within the infection-response transcriptome.
The dominant classification was partial rescue or attenuation
Directional classification assigned 2,930 genes to rescue of pathogen-suppressed expression and 1,394 genes to attenuation of pathogen-induced expression. Only four genes met the report's definition of direct amplification, while 5,970 genes responded to infection without a significant interaction.
A positive or negative interaction term describes departure from an additive expression model. It does not by itself show improved resistance, reduced pathogen growth, direct JCK1241 action, or a specific molecular mechanism.
JCK1241-associated interaction signals opposed several infection-linked pathway shifts
In the interaction ranking, photosynthesis was positively enriched (NES = +2.83, FDR = 3.0 × 10⁻¹⁷), whereas plant MAPK signaling was negatively enriched (NES = −2.06, FDR = 9.0 × 10⁻⁵). These directions oppose the corresponding pathogen main-effect signals and are consistent with partial restoration or attenuation in the combined condition.
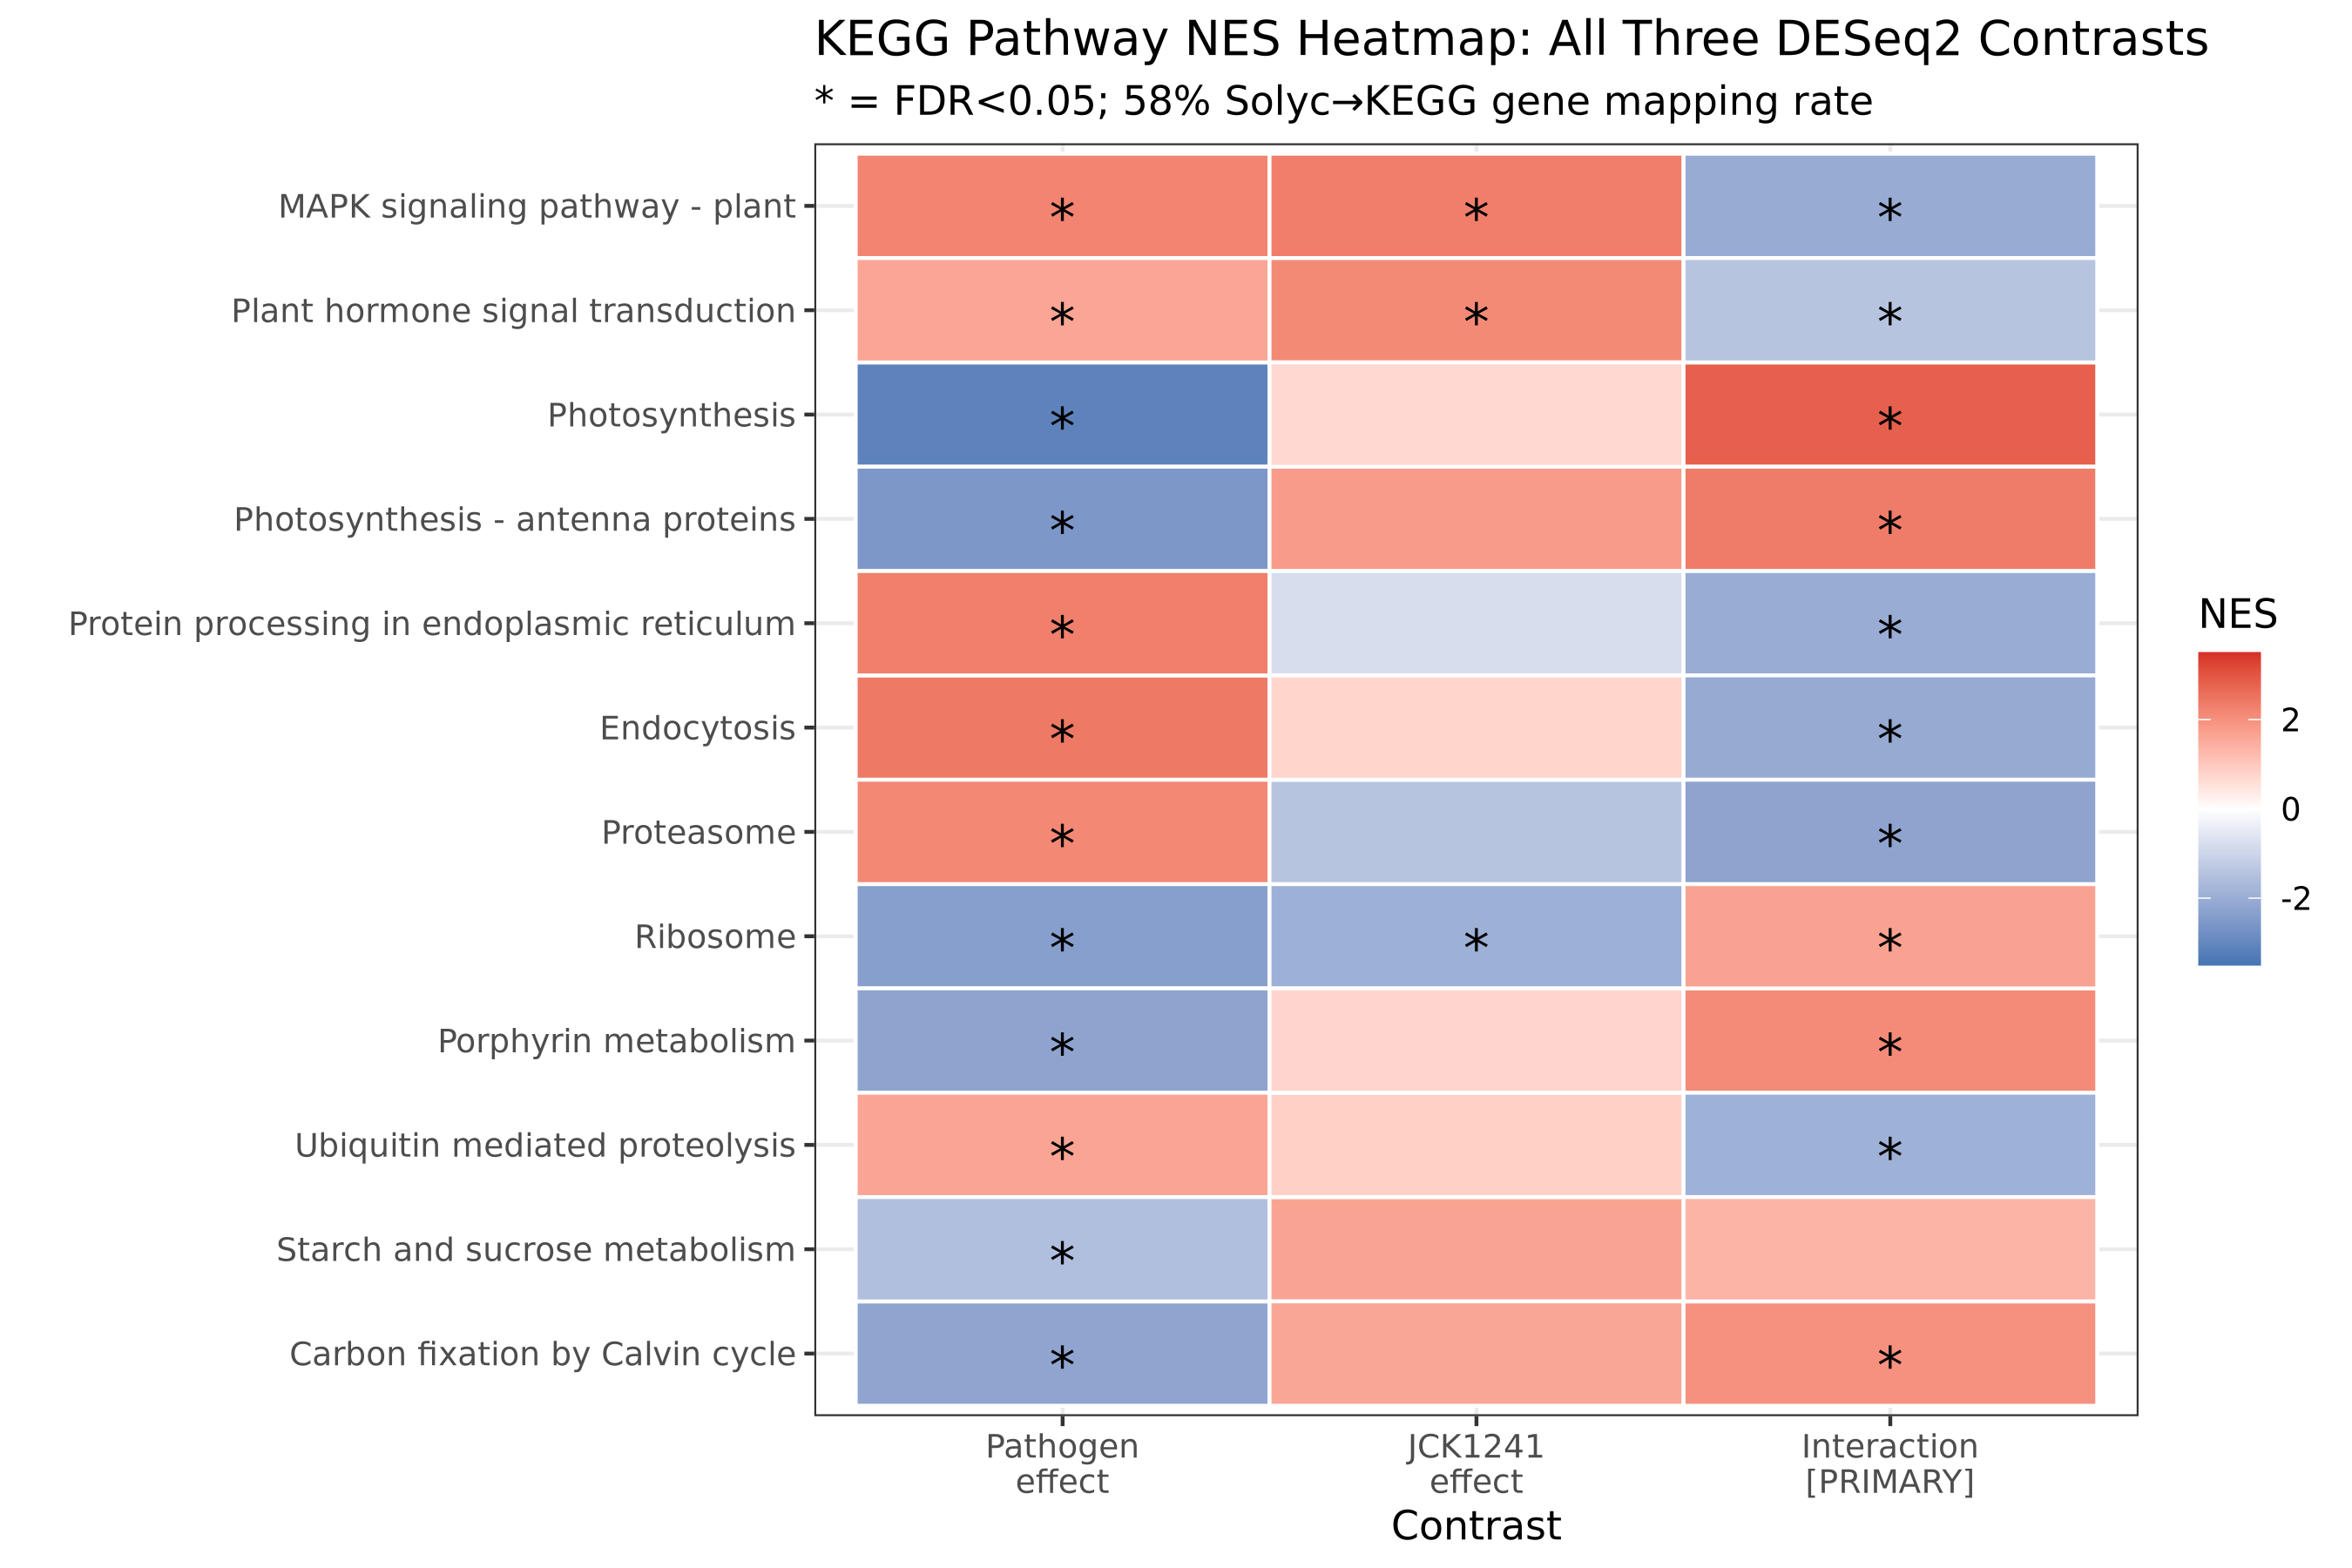
Only 10,441 of 17,997 ranked genes (58%) mapped through the Solyc→UniProt→KEGG bridge, and GO enrichment was unavailable in the first analysis. The pathway results may overrepresent better-annotated gene families and should be treated as exploratory.
Co-expression modules recapitulated pathogen, JCK1241, and interaction-associated patterns
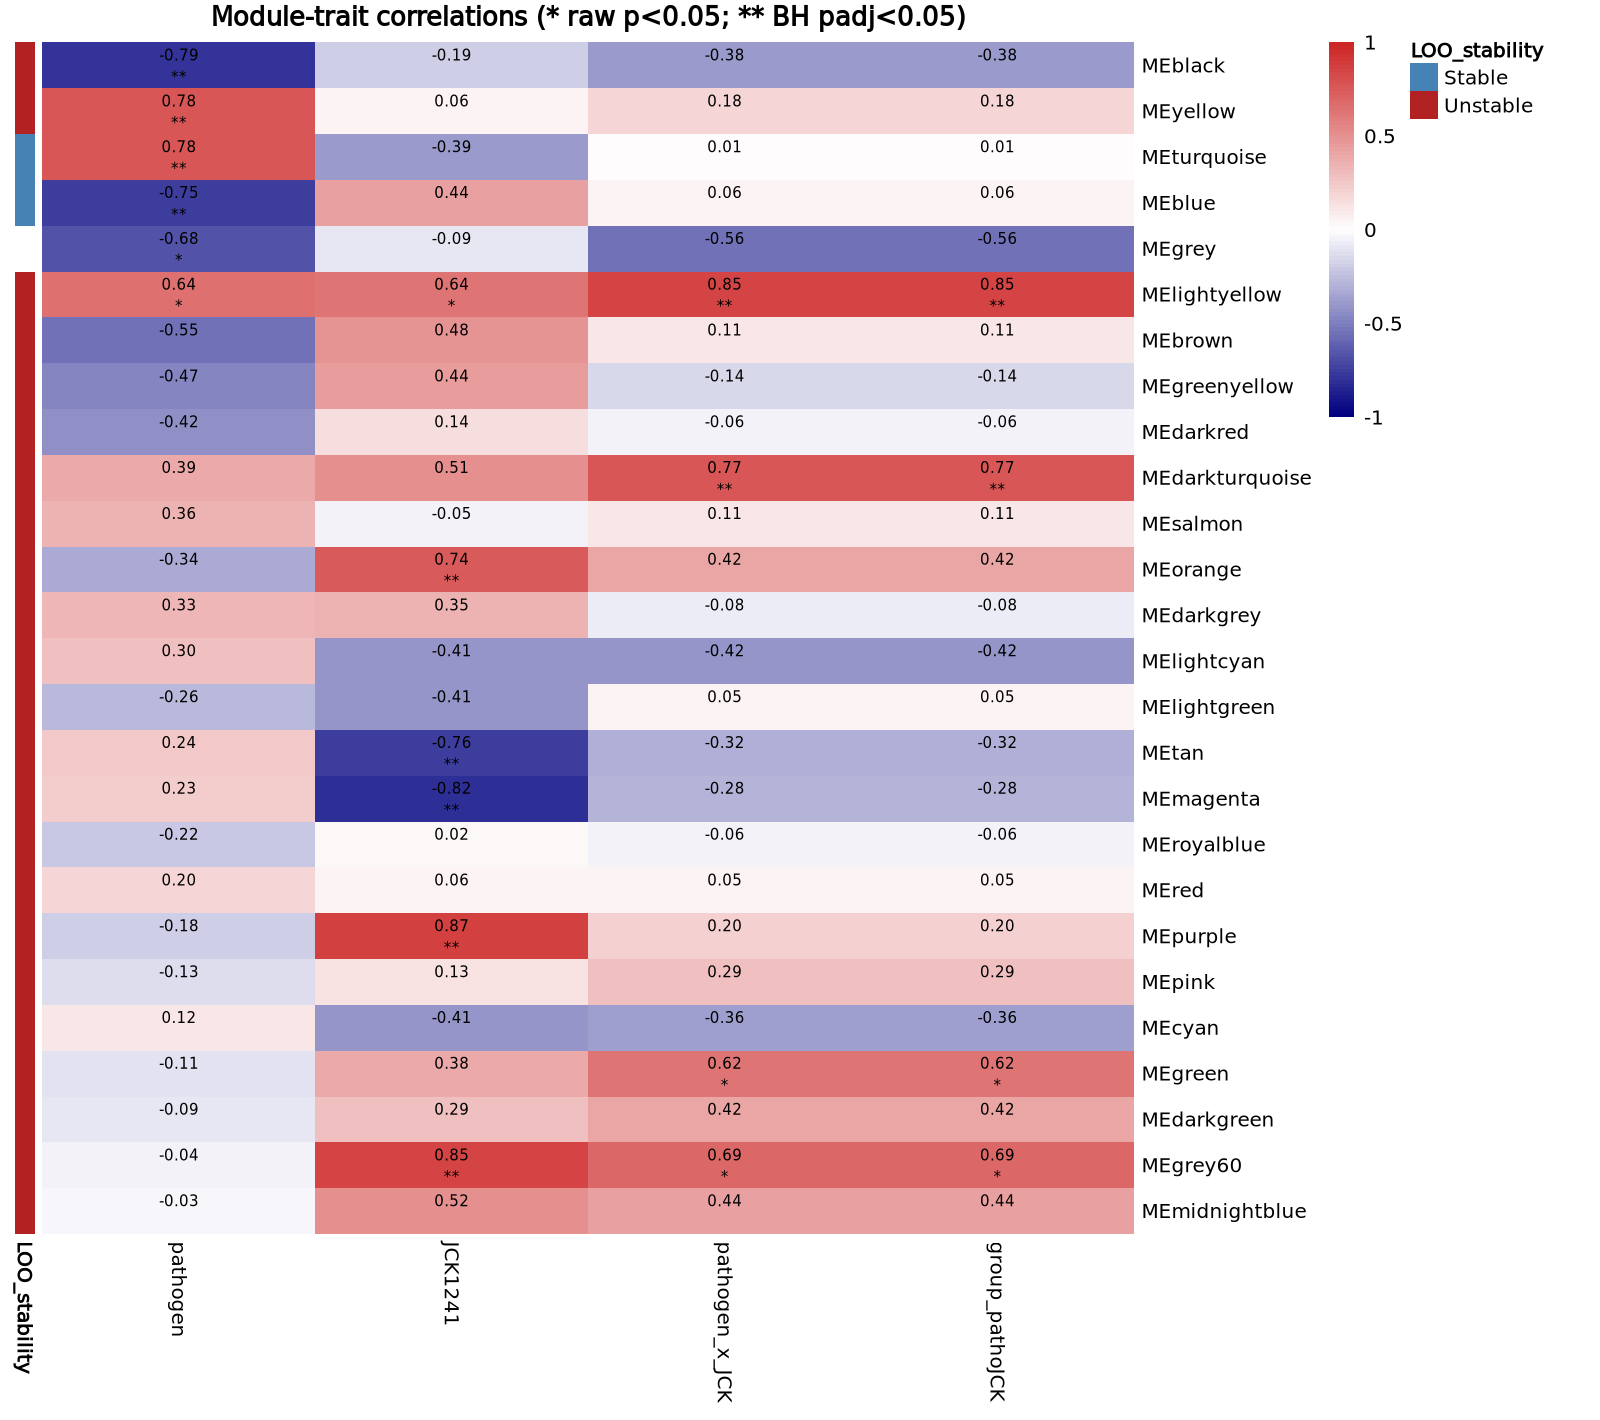
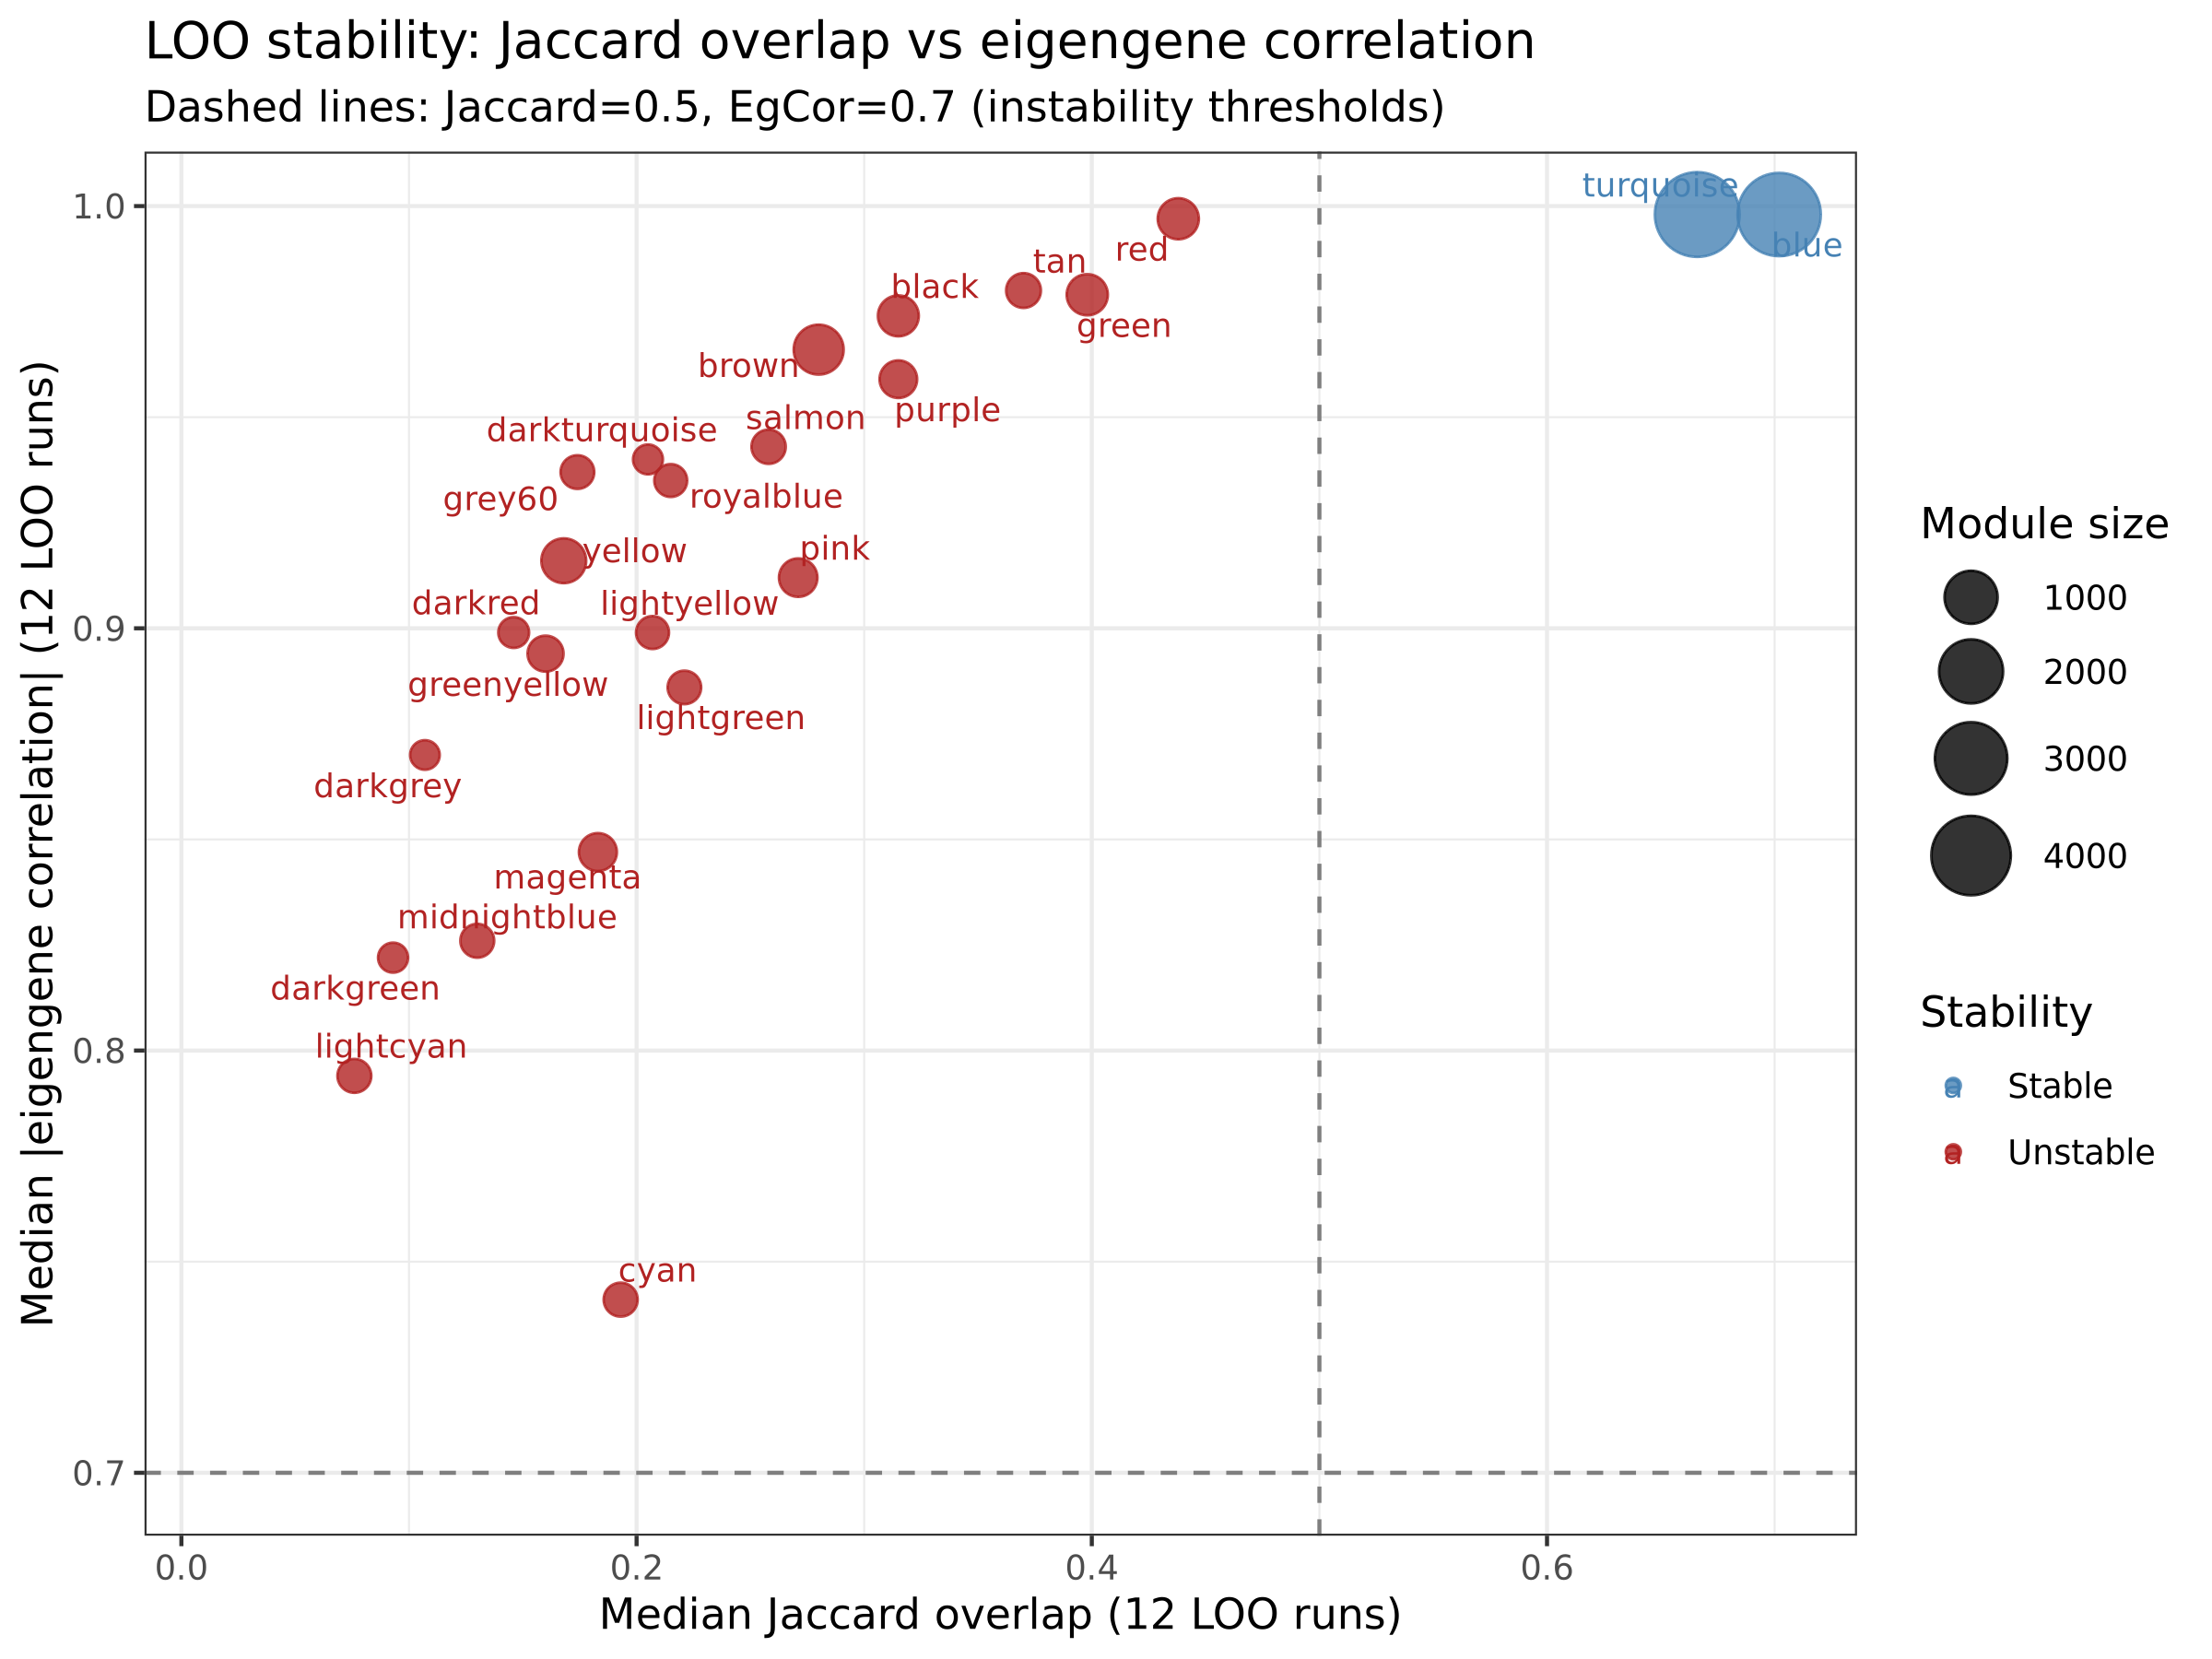
The follow-up network analysis detected 25 modules from 13,497 genes and reported 25 BH-significant module–trait pairs. Several modules aligned with the earlier factorial results, but the network was built from only 12 samples—below the report's stated WGCNA minimum of 15—and most module memberships were unstable under leave-one-out resampling.
The 187-gene module had the strongest JCK1241 association (r = 0.872) and strong overlap with JCK1241-responsive genes, but no significant functional terms.
The 80-gene module had the strongest interaction association (r = 0.854), but no significant enrichment terms and unstable membership.
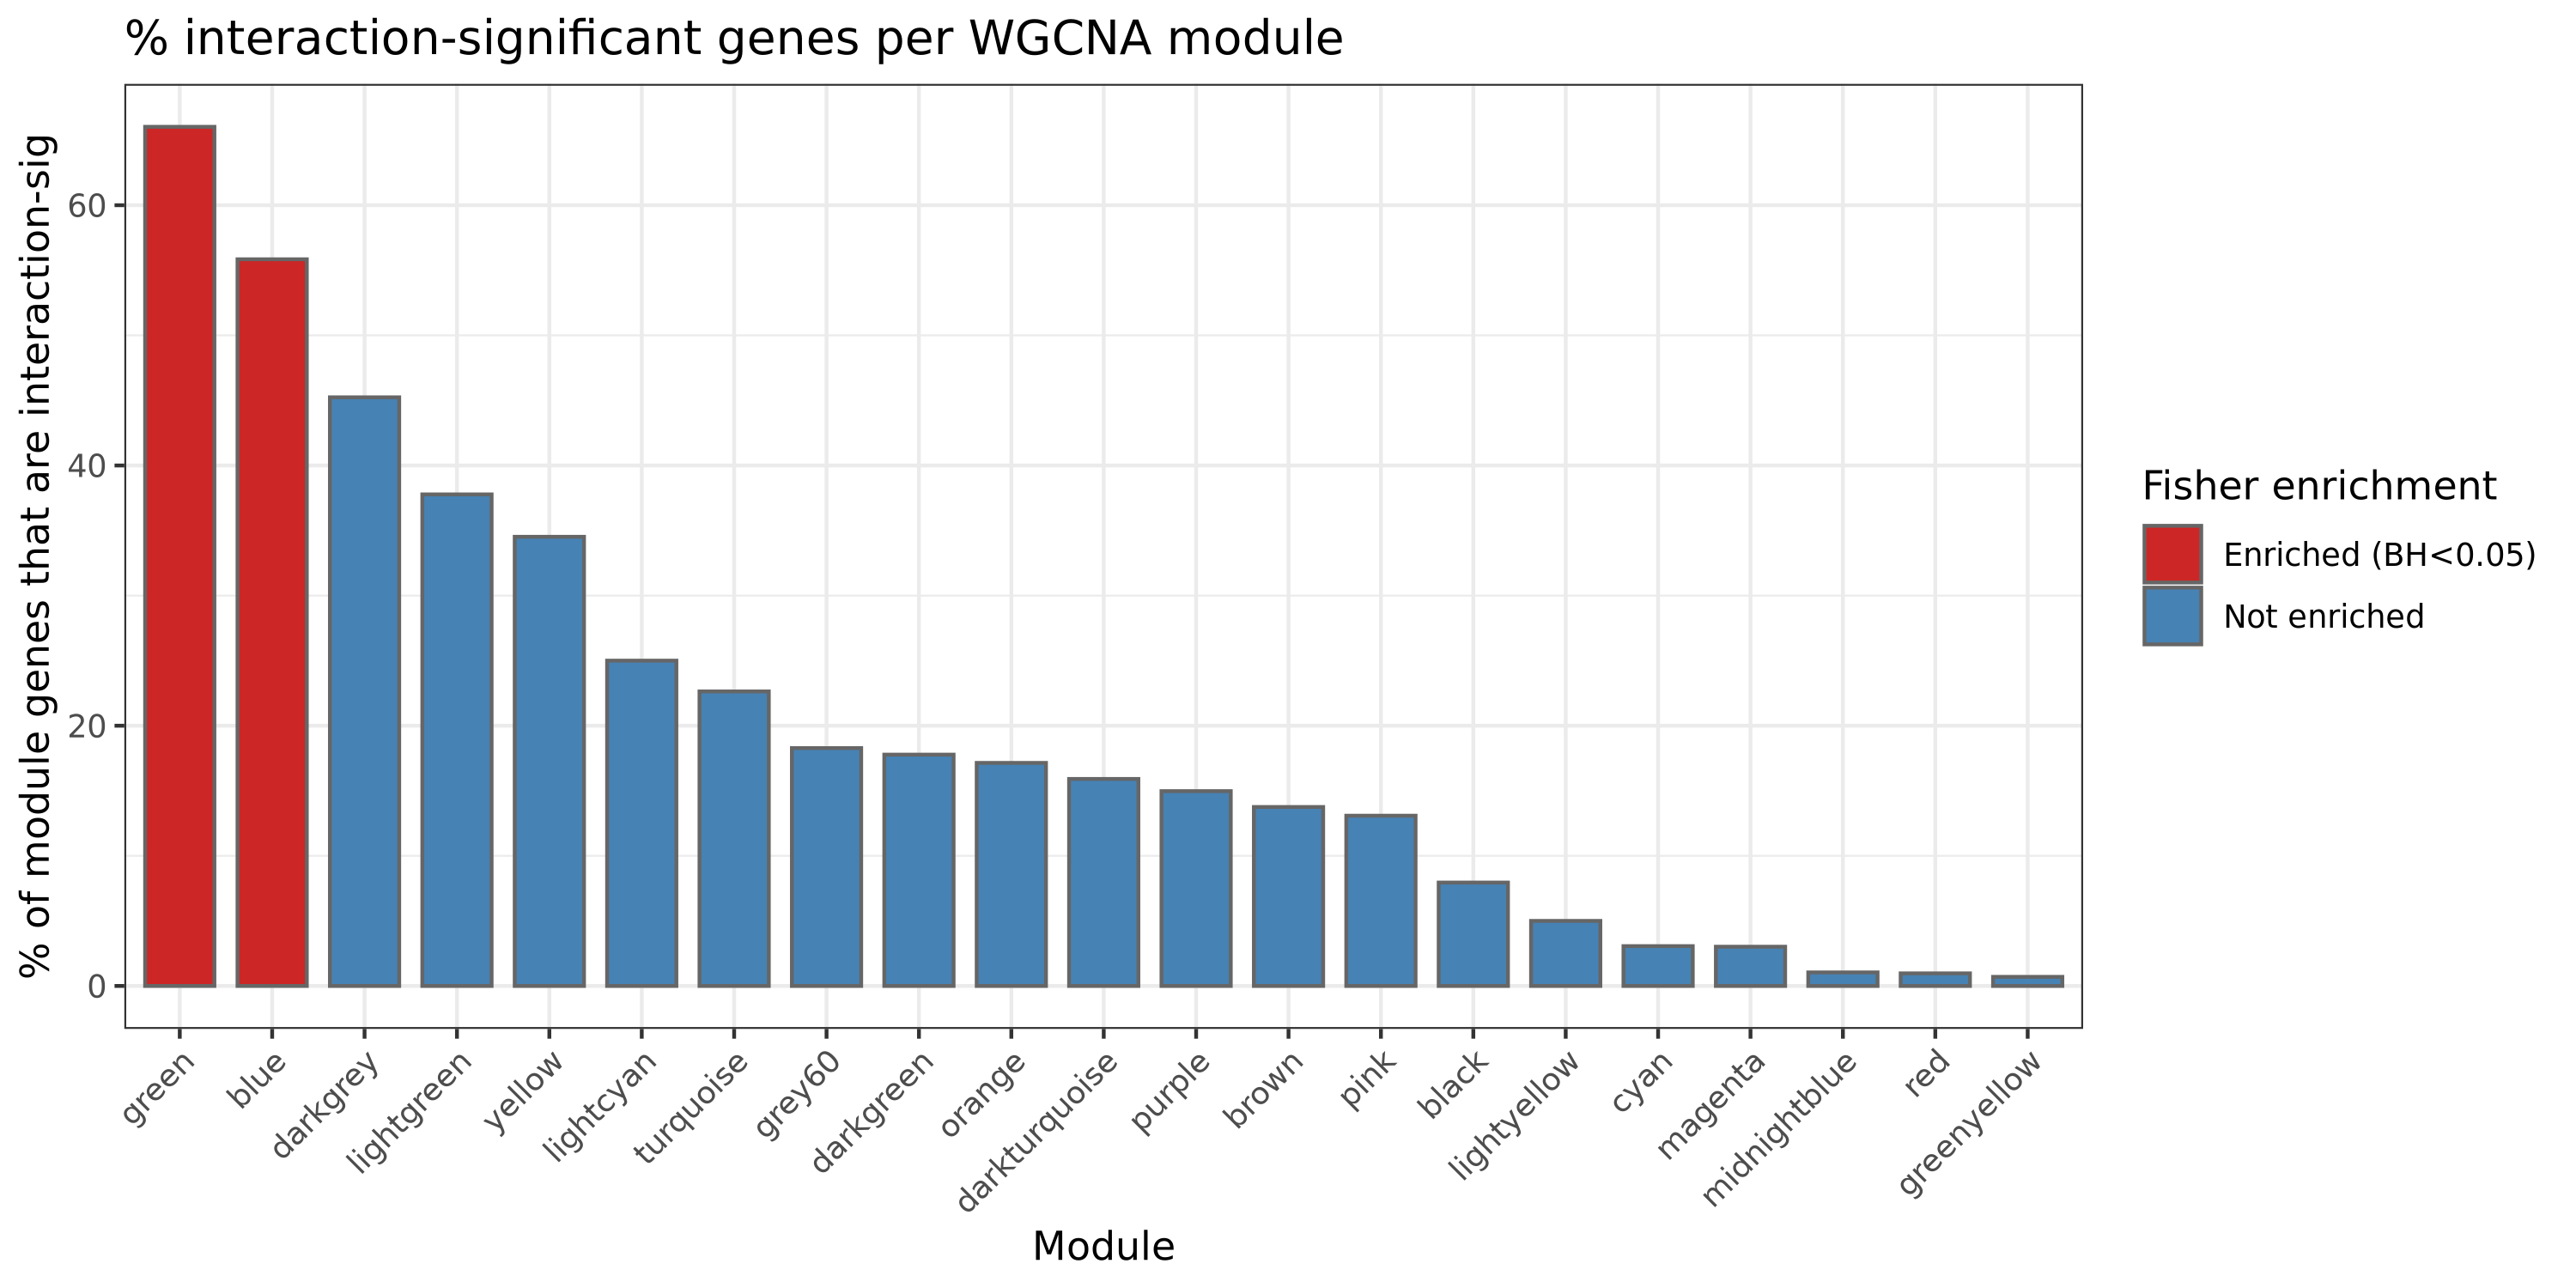
The 312-gene module contained 66% interaction-significant genes and was enriched for defense and biotic-stimulus terms.
The 4,593-gene module was negatively associated with pathogen exposure and enriched for photosynthesis; 56% of its genes were interaction-significant.
What this analysis cannot establish
- Each condition contains only three biological replicates, limiting power and precision for interaction effects.
- A single sampling timepoint cannot distinguish priming, acute activation, attenuation, and recovery phases.
- No pathogen-titre measurement is available, so direct host transcriptional modulation cannot be separated from differences in infection severity.
- Salmon mapping was 61.9–67.2%; rates were uniform across conditions, but absolute-expression interpretation remains limited.
- Only 58% of ranked genes mapped to KEGG in the factorial analysis, and GO terms were unavailable there.
- The WGCNA uses 12 samples, below the report's minimum of 15; scale-free fit reached 0.716 rather than 0.80, and mean connectivity remained high.
- Only two of 25 network modules passed every leave-one-out stability criterion; other module gene lists should not be treated as definitive.
- Transcript abundance and co-expression do not establish protein activity, metabolite changes, disease resistance, yield effects, or causal regulation.
The factorial differential-expression signal is internally consistent and supported by replicate structure. Pathway mechanisms and co-expression modules are exploratory hypotheses for independent validation, not confirmatory evidence of how JCK1241 acts.
Count matrices, complete contrasts, pathway results, network tables, and stability diagnostics
The session report records the artifacts below. This website publishes the complete 74-page session PDF and selected figures; the remaining files are documented here for provenance.
results/gene_counts.csv34,650-gene count matrix across 12 samplesresults/de_pathogen_effect.csvComplete DESeq2 pathogen main-effect resultsresults/de_JCK1241_effect.csvComplete DESeq2 JCK1241 main-effect resultsresults/de_interaction.csvComplete primary pathogen×JCK1241 interaction resultsresults/gene_classification_all.csvDirectional interaction classification for all tested genesresults/gsea_interaction_kegg.csvInteraction-ranked KEGG GSEA resultsresults/module_summary.csvIntegrated WGCNA module traits, stability, overlap, and enrichmentresults/top_hubs_key_modules.csvDescriptive hub rankings for selected modulesresults/loo_stability.csvRecovery, Jaccard, eigengene-correlation, and stability flags across 12 leave-one-out runsresults/analysis_flags.jsonMachine-readable design, QC, annotation, and interpretation warnings